

We have seen quite a lot of bullish action in the bitcoin price throughout the end of the weekend and during Monday’s session, and – in our twice-daily bitcoin price watch piece that we published yesterday evening – we suggested that if a fundamentally driven market sentiment (based on what is happening in Greece) can continue to keep hold of asset prices, there could be further bullish momentum to come. As it happens, having reached highs yesterday just shy of 280 flat, with seen something of a medium-term correction in the bitcoin price, and lost about $10 throughout the Asian session. The question now is, is this just a short-term self as a response to the bullish action and a certain level of profit-taking (similar to what we might see in the Forex markets), or has the uptrend into an end and we set for further downside momentum during today’s session? Reality, we don’t really know, but we can line up our key levels against both sides of the bitcoin price, and use our intraday breakout strategy to draw profit regardless of direction.
So, with this said, take a quick look at the chart below.
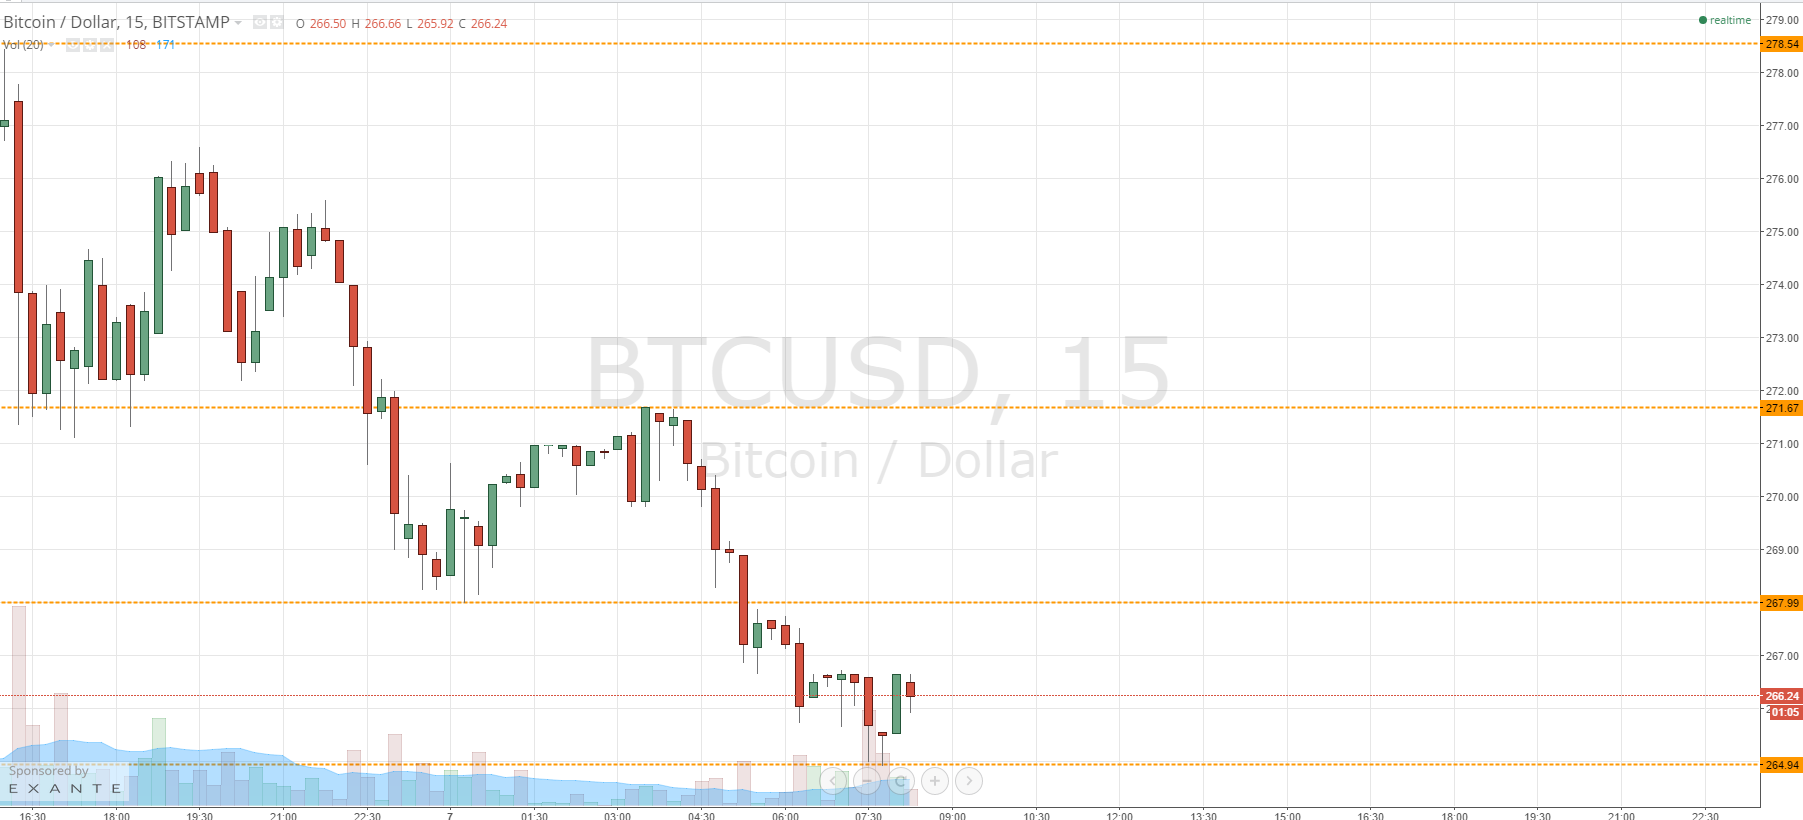
As you can see, having decline from highs at 278.54 yesterday evening, the bitcoin price now trading between what serves as in term support at 264.94 (intraday lows) and in term resistance at 267.99. These are the two levels that we will be watching during today’s session. If we get a break above 267.99, it could spark a return to the upside momentum we have seen throughout the first half of this week, and would validate 271.67 as an initial upside target going forward. Conversely, a break below 264.94 would bring 260 into play to the downside medium-term, with a stop loss somewhere around 266 flat maintaining a positive risk reward profile on the trade.
Charts courtesy of Trading View