Bitcoin Price Key Highlights
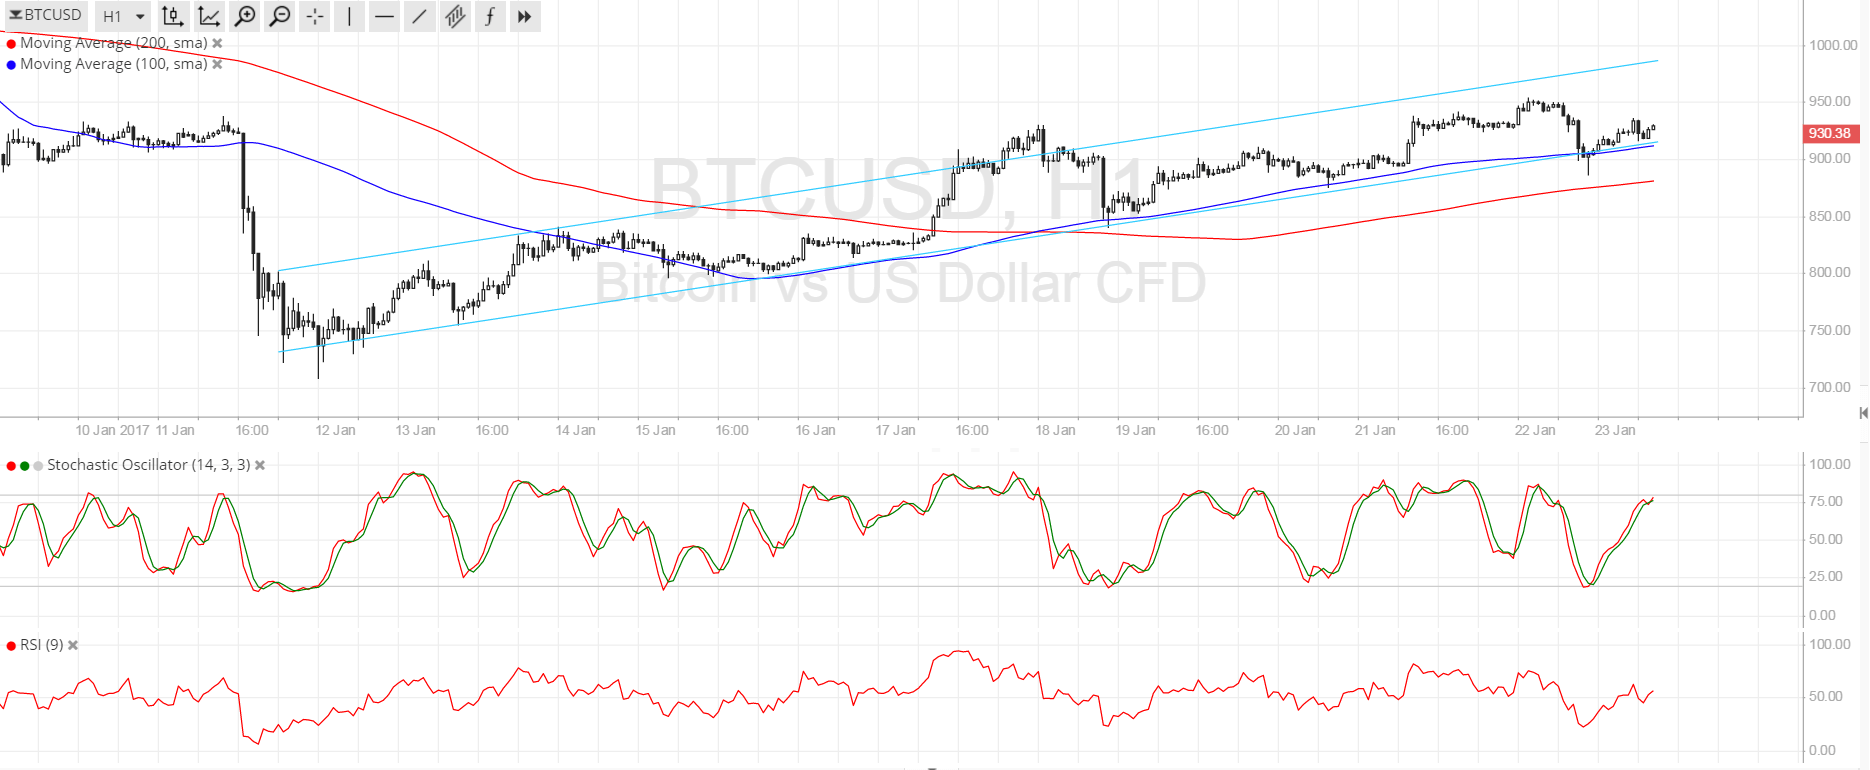
- Bitcoin price is still crawling inside its ascending channel pattern visible on the 1-hour time frame.
- Price seemed to make a downside break from support but the dynamic inflection points held as a floor and kept it on an uptrend.
- Technical indicators seem to be hinting that the climb could carry on, albeit at a slow pace.
Bitcoin price is still keeping up its uptrend but bulls seem to be having a difficult time pushing for more gains.
Technical Indicators Signals
The 100 SMA is above the longer-term 200 SMA so the path of least resistance is to the upside. In addition, the 100 SMA coincides with the channel support at $900, which is probably why it was able to keep losses in check for the time being. If bulls are able to step on the gas, bitcoin price could make its way up to the resistance at $975-1000.
Stochastic is on the move up, which means that buyers are in control of price action for now. RSI is also pointing higher so bitcoin price could head further north. However, if bears refuse to let up, price could still attempt to break below the channel support and the nearby line in the sand at the 200 SMA. A move below this dynamic inflection point at $875 could mark the start of a downtrend.

Market Events
Concerns about stricter bitcoin regulation in China have been dampening bitcoin price gains recently, as a few exchanges have announced that they will no longer be offering certain products that magnify the risks of cryptocurrency trading. Authorities continue to investigate firms and clients involved in bitcoin as part of their efforts to curb offshore investments.
Meanwhile, dollar weakness has been in play since the Trump inauguration as investors seem wary about fiscal policy changes and trade deal negotiations. Traders booked profits off their long dollar positions leading up to the event and even after the actual inauguration, allowing bitcoin to sustain its lead. More headlines on the first few days in office could dictate dollar and bitcoin price flows in the near-term.
Charts from SimpleFX


