Reason to trust

How Our News is Made
Strict editorial policy that focuses on accuracy, relevance, and impartiality
Ad discliamer
Morbi pretium leo et nisl aliquam mollis. Quisque arcu lorem, ultricies quis pellentesque nec, ullamcorper eu odio.
Bitcoin Price Key Highlights
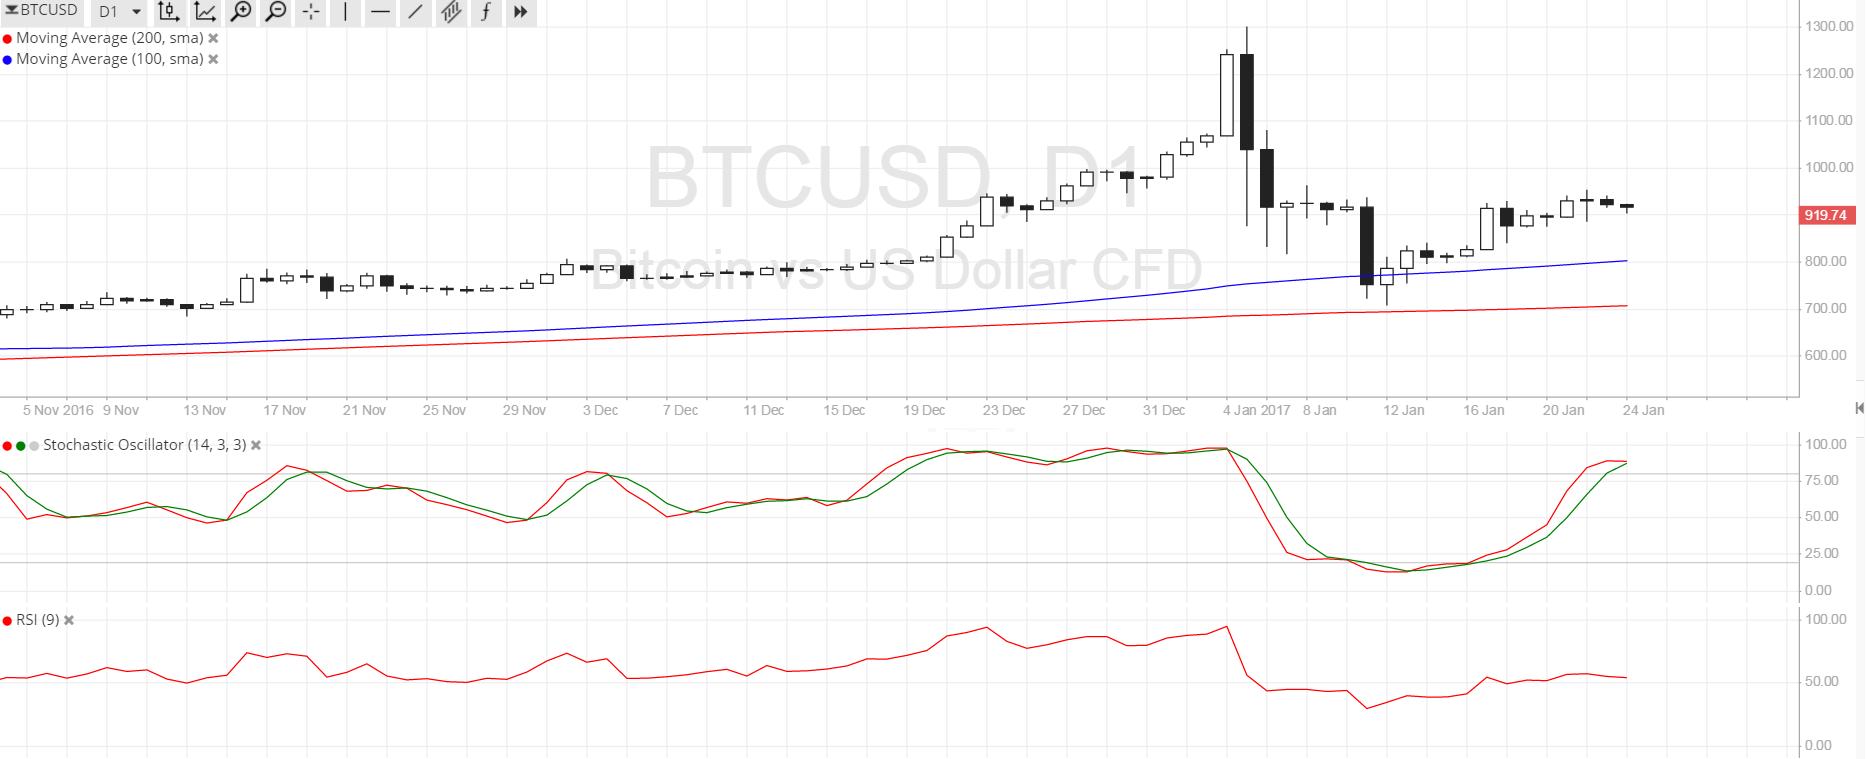
- Bitcoin price seems to be having a tough time pushing past the $900 area, as reversal candlesticks have formed around the area of interest.
- The $900-950 level has held as support and resistance in the past and appears to be functioning as a ceiling now.
- A doji can be seen on the daily time frame with the next candles indicating hesitation.
Bitcoin price could be gearing up for a slide as a doji candlestick can be seen on the daily time frame.
Technical Indicators Signals
The 100 SMA is above the longer-term 200 SMA on the daily time frame so the path of least resistance is to the upside. Also, the gap between the moving averages is widening, which means that buying momentum is getting stronger. If bulls gain enough energy, they could push for a break past the $950-1000 area and a rally onto the highs earlier this year.
However, stochastic is already indicating overbought conditions, which means that buyers are booking profits. This oscillator is also gearing up for a downward crossover and a move lower so bitcoin price might follow suit. RSI is heading slightly higher but also seems to be suggesting range-bound conditions for the time being. A selloff could take bitcoin price back to the $700 lows near the 200 SMA dynamic support or at least until the 100 SMA at $800 for a pullback.

Market Events
The mood in the financial markets recently is that of caution, partly for the new Trump administration and for the ongoing crackdown in bitcoin exchanges in China. Last week, a couple of big trading platforms announced that they’d cease offering margin accounts on bitcoin since these magnify the trading risks involved.
Authorities continue to investigate bitcoin firms and clients as part of their efforts to curb offshore investment and prevent traders from putting speculative bets on the yuan. The Trump administration has also mentioned its plans to look into currency manipulation activity in China. Investors are wary of stricter restrictions so they are reluctant to pile on bitcoin positions at the moment.
Charts from SimpleFX


