Bitcoin Price Key Highlights
- Bitcoin price seems to have broken below the descending triangle pattern illustrated in an earlier article.
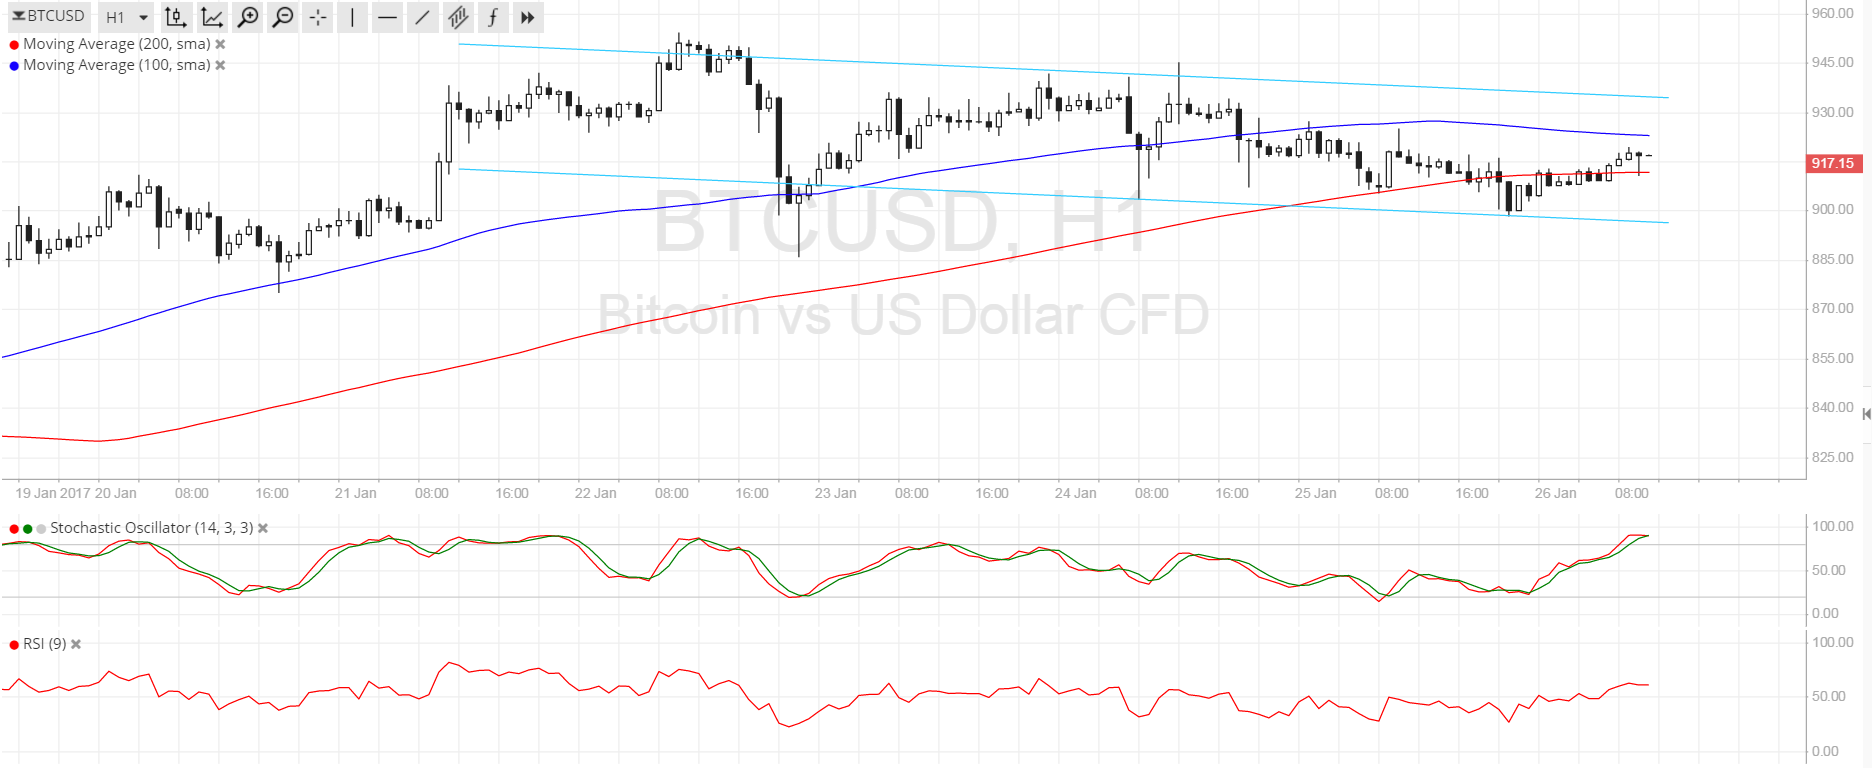
- Price is establishing short-term downside momentum from here, creating a descending channel visible on the 1-hour chart.
- Price just bounced off the channel support and could be due for a test of resistance at $930.
Bitcoin price is slowly making its way down, moving inside a descending channel on its short-term time frames.
Technical Indicators Signals
The 100 SMA is above the longer-term 200 SMA so the path of least resistance is still to the upside. However, the gap between the moving averages is narrowing, reflecting weakening bullish momentum. If a downward crossover materializes, bearish pressure could pick up and trigger a sharper selloff for bitcoin price.
Stochastic is on the move up but is already dipping into the overbought region, signaling that buyers are tired from the climb and are ready to let sellers take over. RSI is still heading up so bitcoin price might still follow suit and go for a test of the channel resistance.
A strong breakout past the $930 area could draw buyers back to the game and allow the cryptocurrency to get back on its longer-term climb. On the other hand, a break below the channel support could confirm that a longer-term downtrend is underway.

Market Events
The ongoing crackdown by Chinese authorities on bitcoin exchanges and clients continues to sour the mood of investors in the mainland, leading to more liquidation of long positions and reluctance to open new ones. Activity has been subdued as liquidity is low, taking its toll on the asset’s volatility.
Just recently, a few exchanges announced that they will be charging higher fees on transactions in order to comply with regulation. Their statements indicated that these fees are intended to “further curb market manipulation and extreme volatility,” leading many to speculate that officials have forced their hand and will continue with their efforts to curtail bitcoin trading in the country.
Charts from SimpleFX


