Bitcoin Price Key Highlights
- Bitcoin price continues to push higher after signaling strong upside momentum.
- Price is testing the key resistance area around $1000 but has formed a bullish continuation pattern.
- Technical indicators are showing mixed signals but market catalysts suggest that profit-taking is possible.
Bitcoin price looks poised for more gains but upcoming market events could spur profit-taking ahead of the weekend.
Technical Indicators Signals
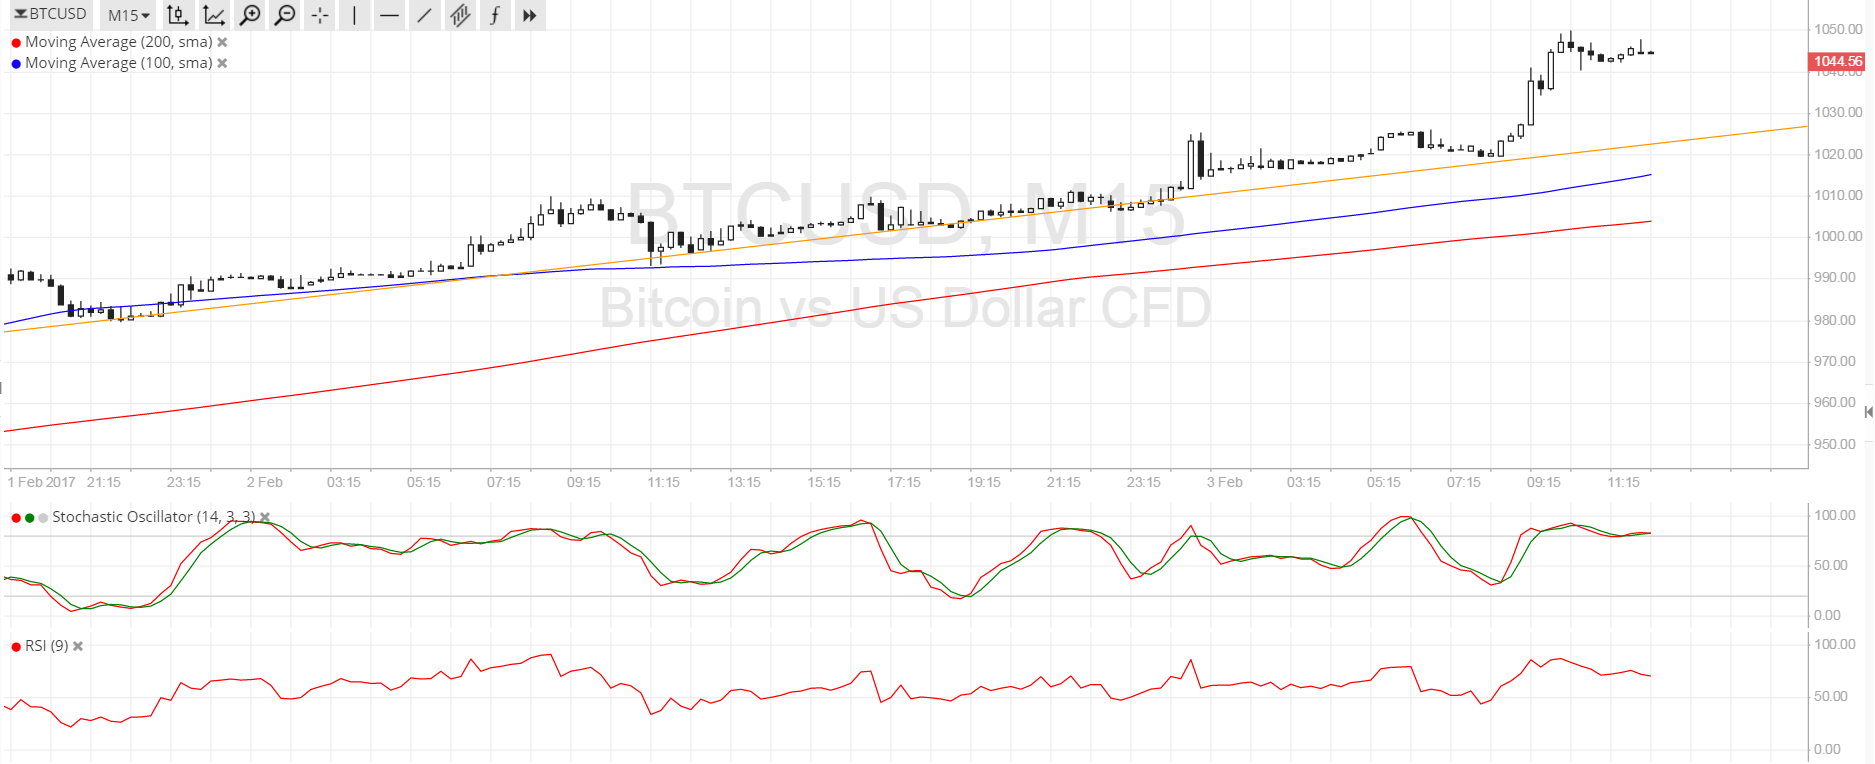
The 100 SMA is above the longer-term 200 SMA on the short-term time frames so the path of least resistance is to the upside. On the 15-min and 1-hour charts, bitcoin price is moving above an ascending trend line connecting the lows since the start of February and might be due for a pullback. The 100 SMA is close to the trend line, adding to its strength as a floor.
Stochastic has been indicating overbought conditions for quite some time and might be ready to turn lower. If so, sellers could take control of price action and spur a correction to the trend line support at $1025-1030. A break below this level could lead to a test of the 200 SMA dynamic support right at $1000, which might be the line in the sand for this uptrend.
RSI is starting to turn lower to suggest weakening buying pressure. However, if buyers continue to push higher, a break past the $1050 area could pave the way for a climb to $1100 and beyond.

Market Events
Bitcoin price continues to benefit from dollar weakness spurred by uncertainty in the US economy. However, the upcoming NFP release could reinforce rate hike expectations for the Fed if the results turn out much stronger than expected. Analysts are projecting a 170K gain in hiring but jobs reports released earlier in the week suggest a likely upside surprise.
On the other hand, downbeat results could trigger more dollar weakness as more market watchers doubt that the FOMC can be able to hike interest rates three times this year. To top it off, more jitters stemming from the Trump administration could push the US currency lower across the board.
Charts from SimpleFX


