Bitcoin Price Key Highlights
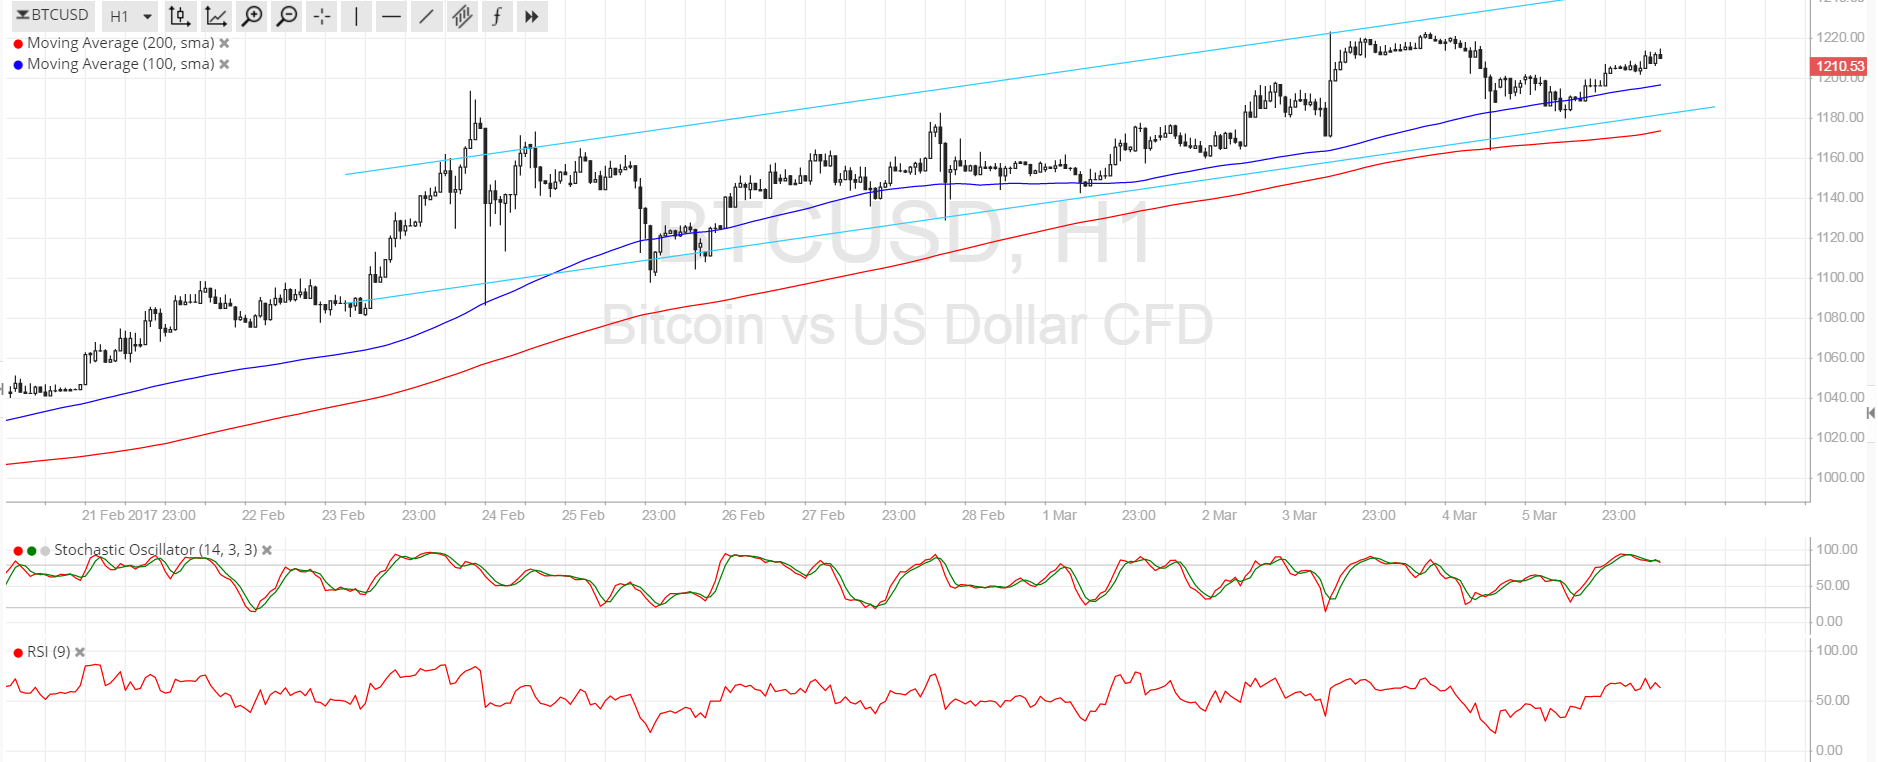
- Bitcoin price continues to trend higher, moving inside an ascending channel visible on its 1-hour time frame.
- Price made a pullback after breaking above a wedge formation and hitting the $1220 levels.
- The channel support and 100 SMA were able to keep losses in check so bitcoin price could gear up for another test of resistance from here.
Bitcoin price is still on a climb inside its bullish channel pattern after dipping to support. Further gains could be in the cards pending this week’s developments.
Technical Indicators Signals
The 100 SMA is safely above the longer-term 200 SMA on this time frame, confirming that the path of least resistance is to the upside. In addition, the 100 SMA has held as dynamic support on the latest pullback while the 200 SMA dynamic inflection point is close to the bottom of the ascending channel at $1180, adding to its strength as a floor.
The gap between the moving averages is widening, which means that bullish pressure is getting stronger. However, stochastic is already indicating overbought conditions and might be ready to turn lower, possibly indicating a return in selling momentum. RSI is in the overbought zone also, reflecting exhaustion among bulls and also hinting at a potential dip.
If bearish momentum kicks in, bitcoin price could break below the channel support and the 200 SMA, likely indicating a reversal from the ongoing uptrend. If that happens, price could head to the next area of interest at $1150 then at $1100.

Market Events
Bitcoin traders are looking towards the SEC decision for the Winklevoss twins’ COIN ETF approval, which holds the potential of making bitcoin investments more accessible to individual and institutional investors. Not only would this drastically increase liquidity and market interest in bitcoin but it could also encourage other bitcoin funds to be created.
However, if the SEC adds to their list of requirements once more, bitcoin price could erase its recent gains as traders book profits off market expectations and wait for the next big catalyst.
Charts from SimpleFX


