Bitcoin Price Key Highlights
- Bitcoin price sold off yesterday once more but it seems to be finding support at a major area of interest.
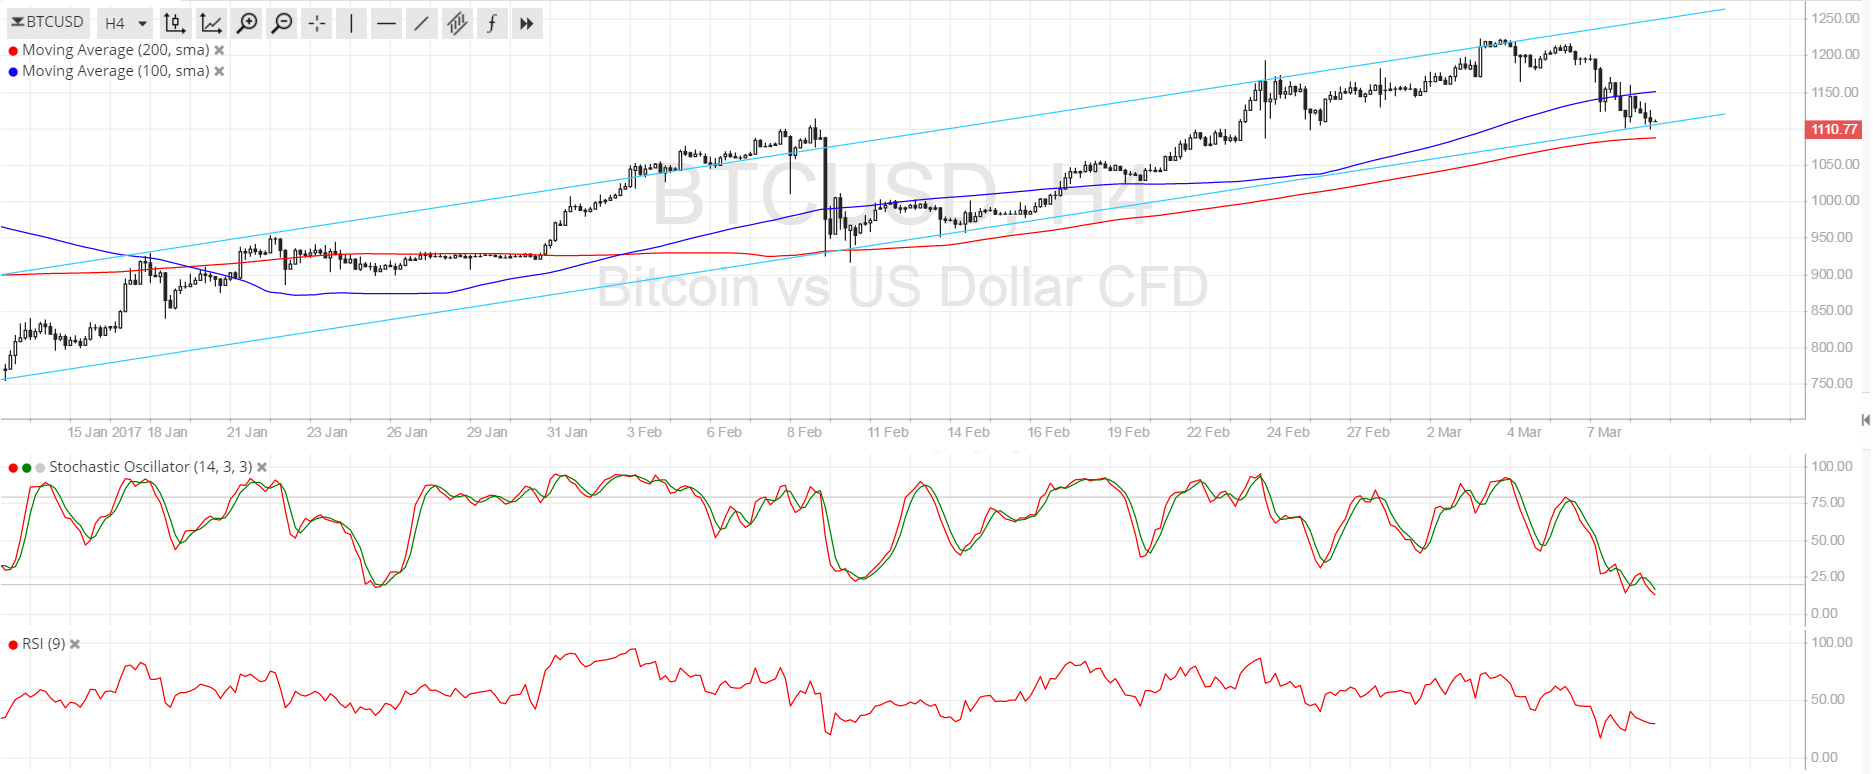
- Price is still moving inside an ascending channel formation visible on the 4-hour time frame and is testing support.
- A bounce off this area could take bitcoin price back up to the resistance around $1250 or higher.
Bitcoin price seems to be down to its line in the sand for the uptrend, as a break below this area could lead to a longer-term selloff.
Technical Indicators Signals
The 100 SMA is still above the longer-term 200 SMA on the 4-hour time frame, confirming that the path of least resistance is to the upside and that the climb is likely to continue. Also, the gap between the moving averages is widening to indicate that bullish pressure is strengthening.
Price broke below the 100 SMA to show that sellers are trying to push it lower, but the 200 SMA appears to be holding as dynamic support so far. This coincides with the channel support and a former resistance level, which suggest that there could be plenty of orders waiting right here.
Stochastic is on the move down to show that sellers are in control of price action. However, this particular oscillator is already dipping into oversold territory to indicate seller exhaustion. If buyers are able to take over and stochastic heads back up, bitcoin price could follow suit. RSI is also heading south and has a ways to go before hitting the oversold area.

Market Events
Dollar strength has been in play over the past few days as traders continue to build up expectations for a Fed rate hike in the next meeting. Not only have most policymakers affirmed their hawkish bias but data has been mostly upbeat so far.
For one, the ADP figure for February printed a huge gain of 298K versus the projected 185K rise. To top it off, the January reading was upgraded so market watchers are expecting the same results for the official NFP report due on on Friday, sealing the deal for a March hike.
Charts from SimpleFX


