Bitcoin Price Key Highlights
- Bitcoin price continues to trend higher even with that sharp spike down last week.
- The COIN bitcoin ETF approval was denied by the SEC on March 10, but this hasn’t severely dampened bullish momentum.
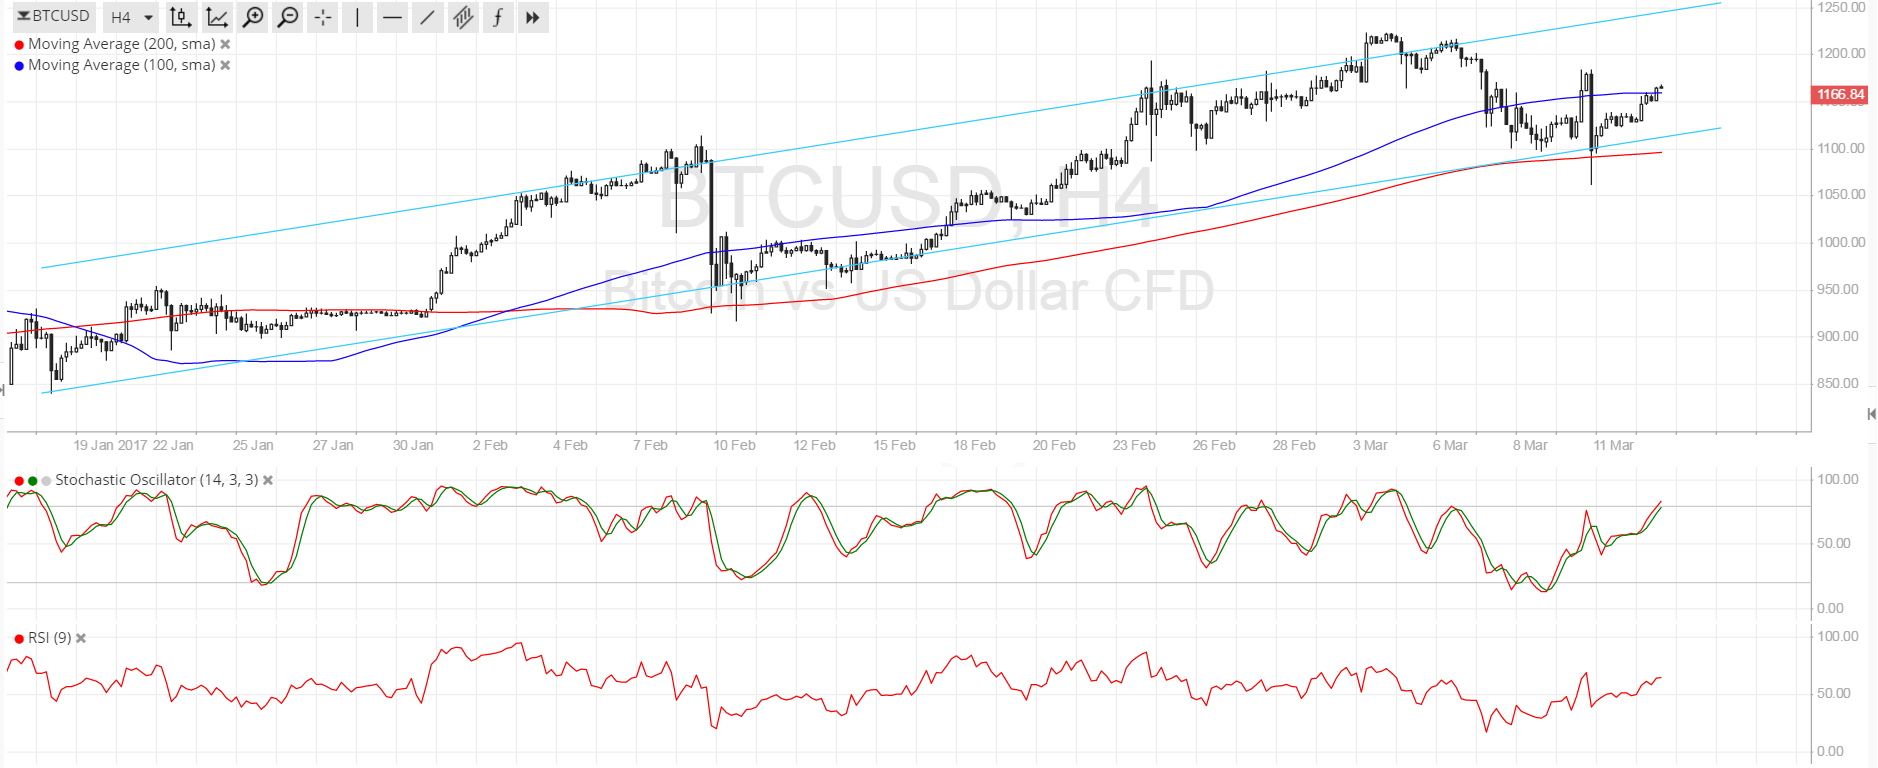
- Bitcoin price is still above its ascending channel pattern visible on the 4-hour time frame and might be due for a bounce back to resistance.
Bitcoin price dropped after the SEC announcement on the COIN ETF but is still holding on to its recent gains.
Technical Indicators Signals
The 100 SMA is above the longer-term 200 SMA so the path of least resistance is to the upside. The gap between the moving averages has also widened to reflect stronger buying pressure. In addition, the 200 SMA dynamic support lines up with the channel support at $1100, which explains why it recently held as a floor.
Stochastic is heading north so bitcoin price could follow suit. RSI is also moving up to show that buyers are in control of price action for now. If bulls keep this up, a move towards the channel resistance at $1250 or higher could take place.
However, once both oscillators indicate overbought conditions and turn lower, bitcoin could be under some selling pressure as well. In that case, another test of the channel support could be underway and a breakdown could spur a reversal from the climb.

Market Events
Bitcoin price was hit by a double-whammy of the SEC COIN ETF rejection and the stronger than expected US NFP report. The latter basically confirms that the Fed would hike interest rates in their monetary policy meeting this week as policymakers have assessed that tightening sooner rather than later would be more beneficial for the US economy.
Still, additional volatility is to be expected during the event and bitcoin price could benefit from profit-taking activity on long dollar positions. Apart from that, market watchers could also react to updated Fed forecasts and price in expectations for the central bank’s next steps throughout the year.
Charts from SimpleFX


