Bitcoin Price Key Highlights
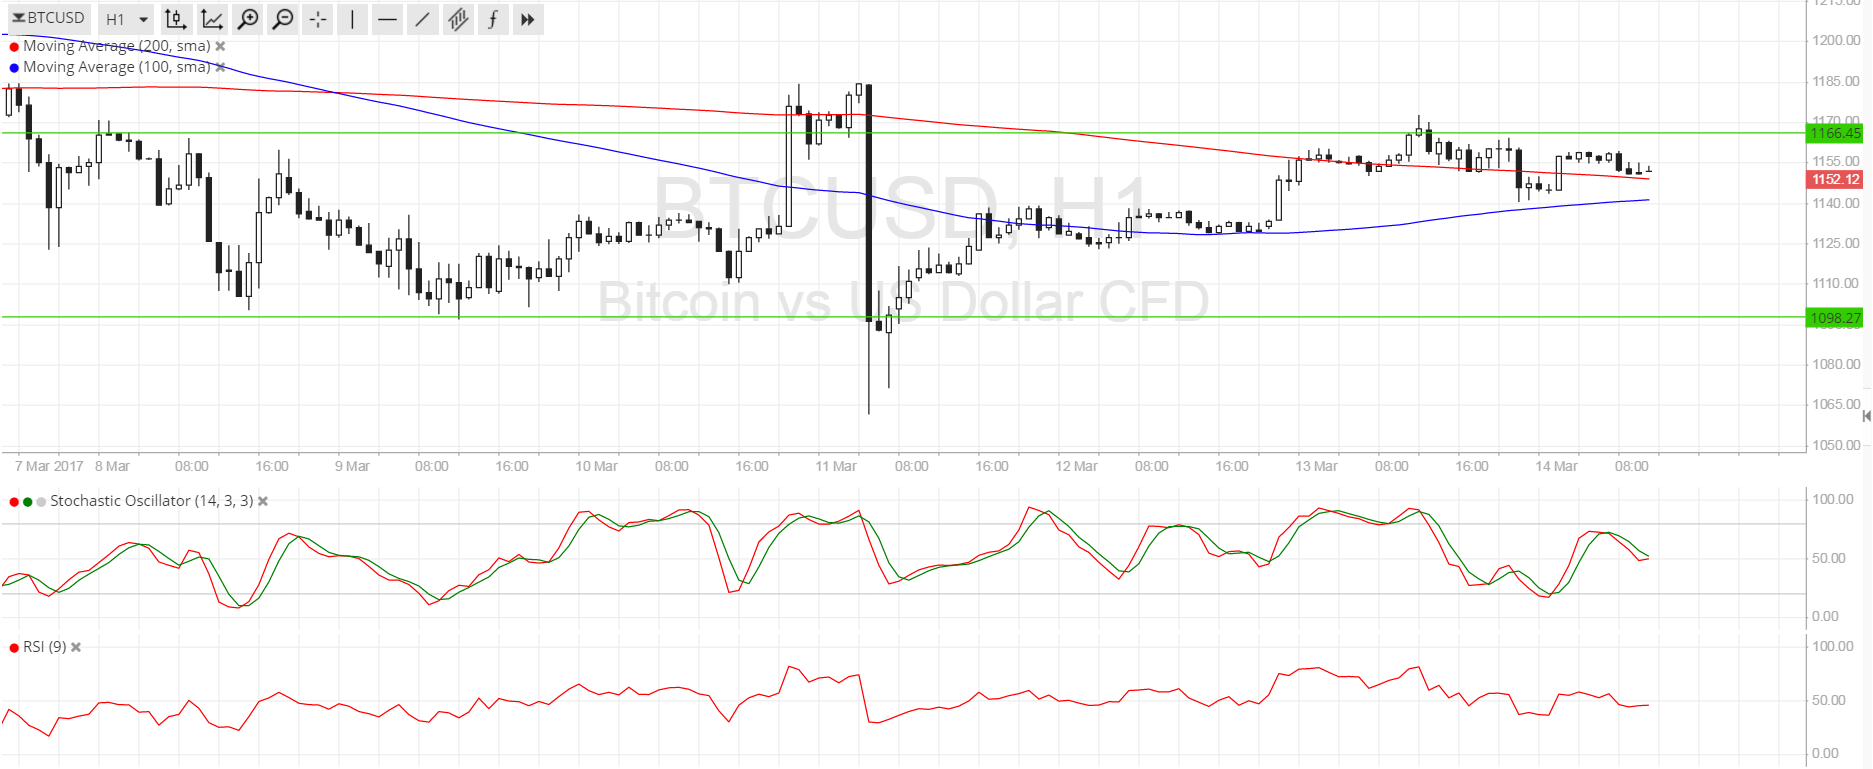
- Bitcoin price has been moving sideways, bouncing off support at $1100 and testing resistance at $1170.
- Price is hovering around the resistance at the moment and a move back to support could be in the cards.
- Technical indicators are showing that sellers are in control but that a breakout could be possible soon.
Bitcoin price is stuck in a range against the dollar for now as traders are holding out for this week’s top-tier events.
Technical Indicators Signals
The 100 SMA is below the longer-term 200 SMA so the path of least resistance is to the downside. This means that the range resistance is more likely to hold than to break.
However, the gap between the moving averages is narrowing so an upward crossover could take place, signaling that bulls are about to take over and push for a break past the range resistance. If so, bitcoin price could climb by around $70 or the same height as the range.
Stochastic is on the move down, though, which means that sellers are on top of their game and have enough energy to push for more losses. RSI is also edging down, indicating that presence of bearish pressure. A break below the 100 SMA dynamic support or the previous lows at $1140 could be enough to reflect selling momentum.

Market Events
The main event for BTCUSD this week might be the FOMC decision, as the Fed is highly expected to hike interest rates by 0.25% following the stronger than expected NFP release last Friday. Should the committee decide against this or hint that they can no longer implement three hikes for the year, the dollar could give up a lot of ground to bitcoin. On the other hand, reiterating their hawkish views by upgrading growth and inflation forecasts could shore up dollar demand and drive bitcoin price losses.
There are several other central banks set to announce their policy decisions this week, providing potential volatility from other markets. For now, though, bitcoin is still reeling from the SEC denial of the COIN ETF and traders are reevaluating their positions.
Charts from SimpleFX


