Bitcoin Price Key Highlights
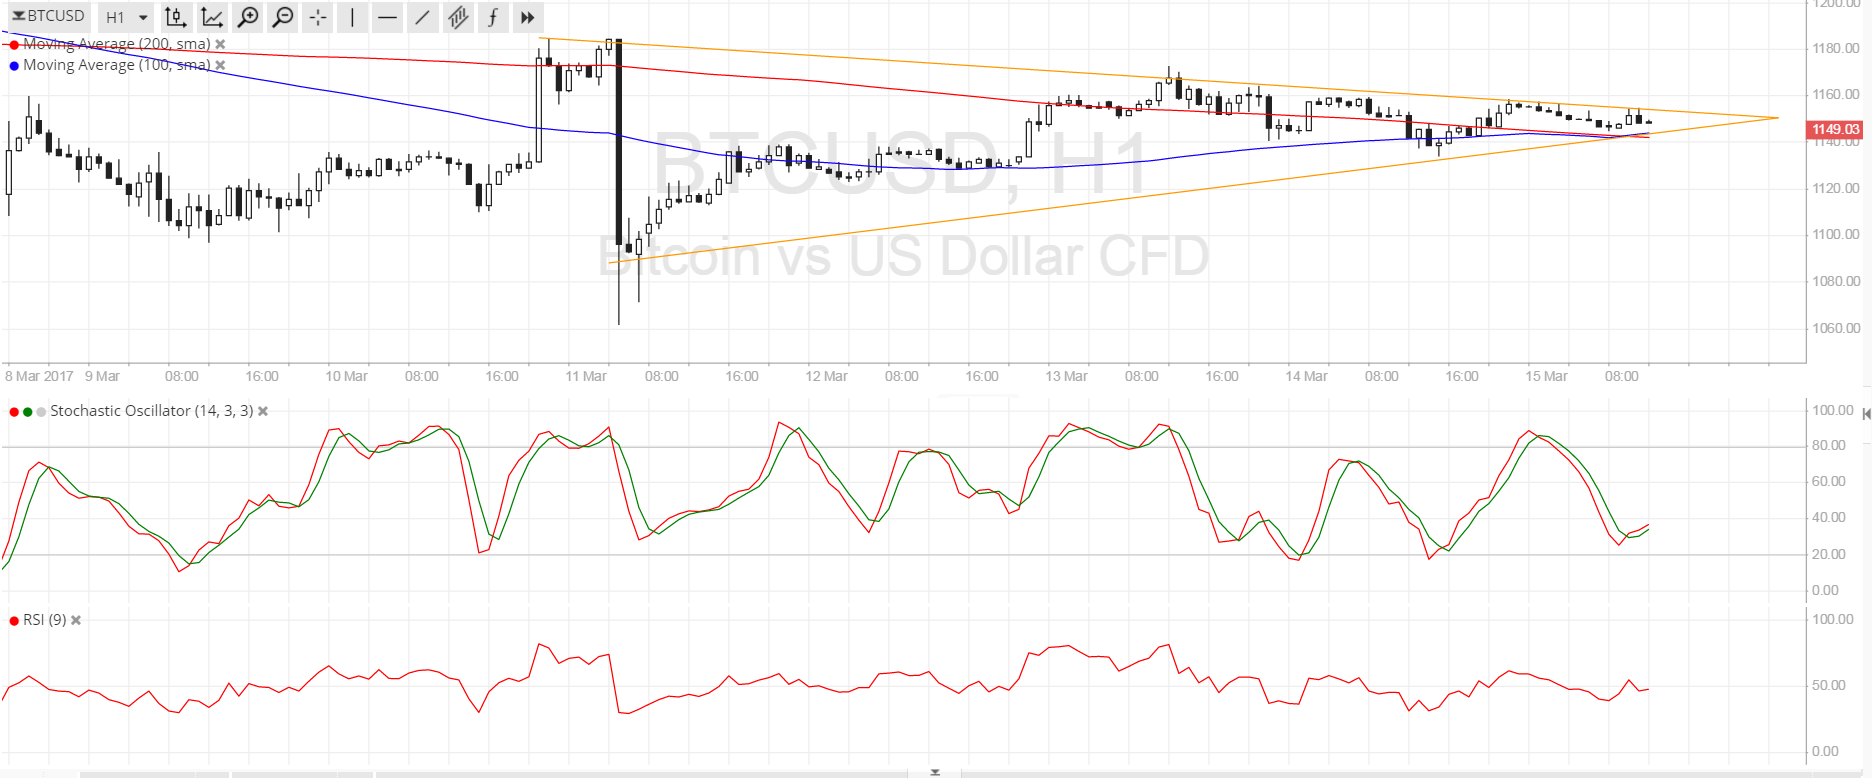
- Bitcoin price has formed higher lows and lower highs, creating a symmetrical triangle formation on the 1-hour time frame.
- Traders are likely holding out from placing any large positions ahead of the top-tier FOMC interest rate statement.
- A breakout in either direction could set the longer-term direction for bitcoin price action.
Bitcoin price is consolidating inside a symmetrical triangle pattern at the moment and a breakout could take place during the FOMC announcement.
Technical Indicators Signals
The 100 SMA is close to the 200 SMA on this time frame, confirming that range-bound conditions are in play. If the short-term SMA ends up below the longer-term one, selling pressure could pick up. On the other hand, an upside crossover could draw more buyers to the mix and set of a climb for bitcoin price.
Stochastic hasn’t quite reached the oversold region just yet but it already appears to be turning higher, indicating a possible return in buying momentum. RSI is on middle ground, barely giving any strong directional clues at the moment.
A long green candle closing above $1155 could be enough to confirm a bullish breakout while a long red candle closing below $1140 could confirm a bearish one. Take note, however, that volatility tends to spike during these major market events so fakeouts are possible.

Market Events
Traders have high hopes for a FOMC interest rate hike in today’s New York session and pricing in ahead of the announcement could allow the dollar to squeeze out a few more gains against bitcoin price. Of particular interest would be the Fed’s upgraded growth and inflation forecasts since this would provide clues on their future policy actions.
Analysts are pricing in 60% odds of June tightening and 80% likelihood in September, but any indication that the US central bank is ready to hike again in another three months would be very bullish for the US dollar. On the other hand, cautious comments from policymakers and Fed head Yellen could force the Greenback to retreat against bitcoin.
Charts from SimpleFX


