Bitcoin Price Key Highlights
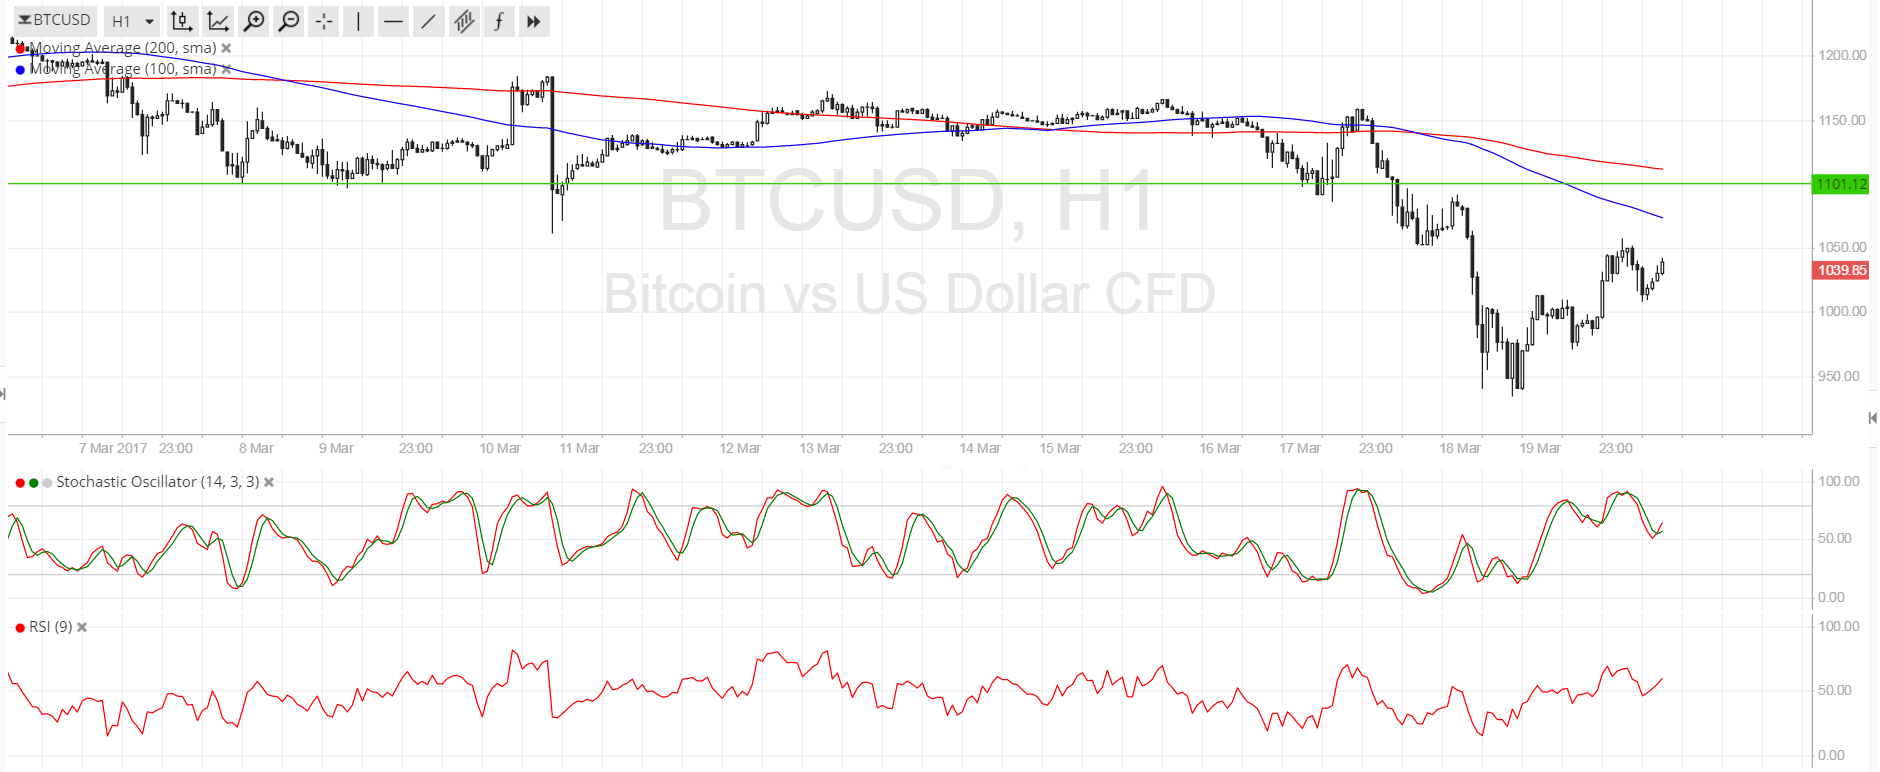
- Bitcoin price recently broke below the key area of interest at $1100, signaling room to head further south.
- Price bounced off the $950 area and may be starting a correction to the broken support zone.
- Technical indicators are showing that the selloff could still resume at some point, so the recent climb may not be enough to revive the uptrend.
Bitcoin price sold off for the past few days but is making a pullback to an area of interest, offering a chance for more sellers to hop in.
Technical Indicators Signals
The 100 SMA is below the longer-term 200 SMA so the path of least resistance is to the downside. In other words, the downtrend is more likely to resume than to reverse. The gap between the moving averages is widening, reflecting stronger selling pressure.
The nearby 100 SMA could already hold as dynamic resistance around the $1050 area, which is also an area of interest. Meanwhile, the 200 SMA is slightly above $1100 but could serve as the line in the sand for the correction. A break above that level could signal that bulls are reganing control.
Stochastic is on the move down from the overbought area, confirming that bearish pressure is in play. RSI is pointing up, though, so there may be some buying momentum left but the oscillator is already nearing overbought conditions. If the selloff resumes, bitcoin price could find its way back to the recent lows at $950 or lower.

Market Events
Bitcoin price was bogged down by a fresh round of doubts on the stability of the cryptocurrency, as talks of a hard fork in the network and setbacks from regulatory agencies led investors to move funds out. This was compounded by the Fed’s decision to hike interest rates, which boosted demand for US assets and the dollar.
Still, some profit-taking on Friday allowed a bounce to take place but it remains to be seen whether or not this is merely a correction from the huge drop. There are no major reports due from the US economy today but President Trump will be speaking so this could inspire a new round of volatility for BTCUSD.
Charts from SimpleFX


