Bitcoin Price Key Highlights
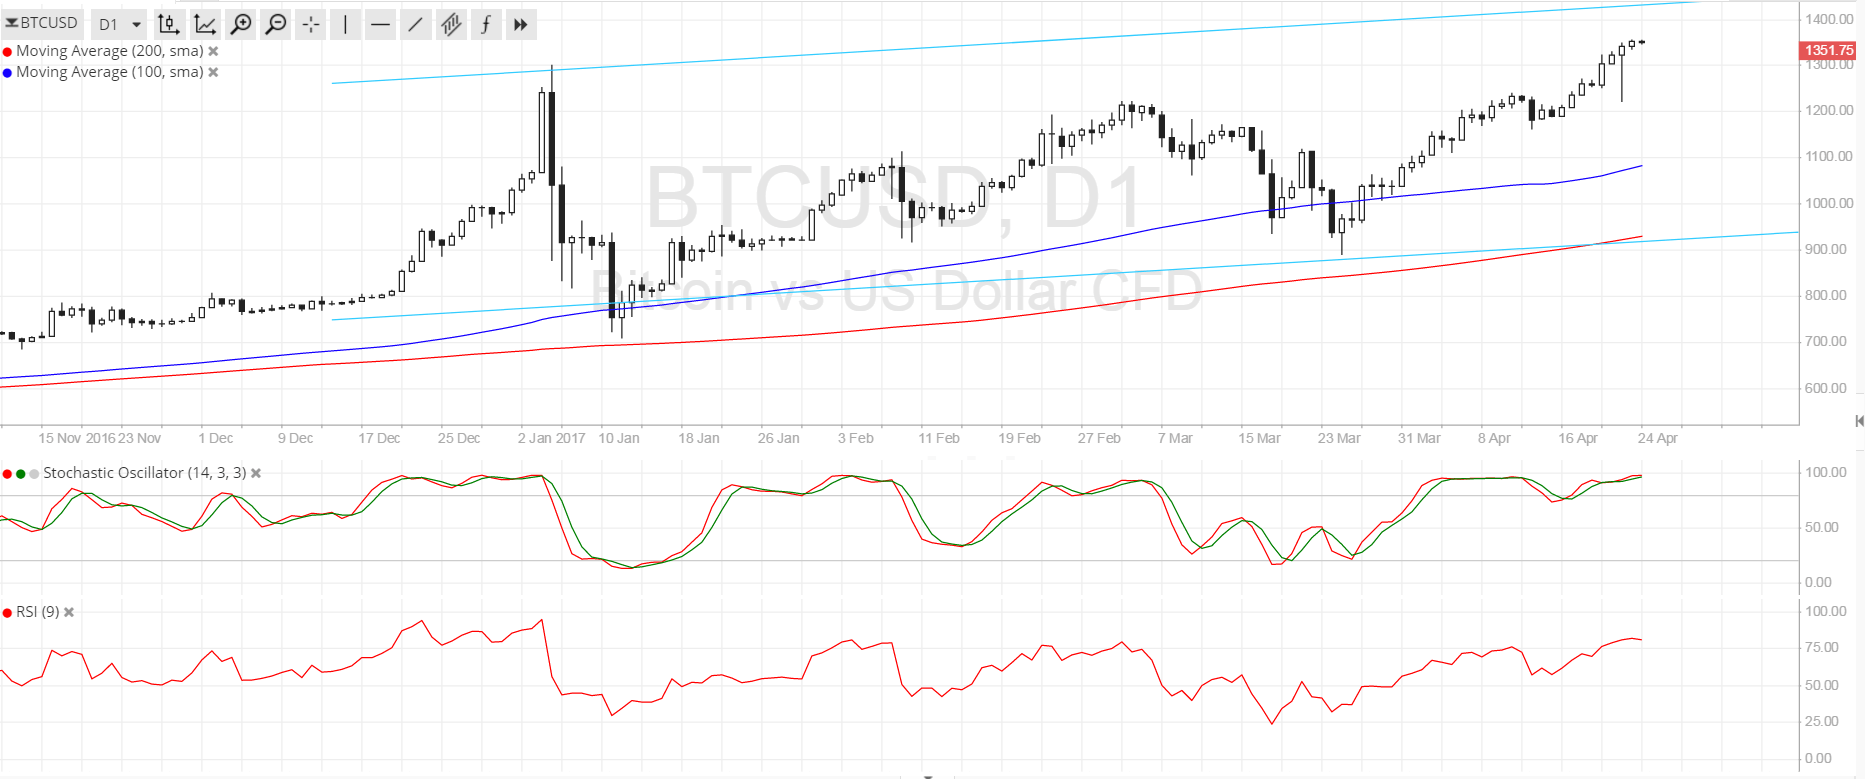
- Bitcoin price is testing record highs around the $1350 area as predicted in the earlier article.
- Price could be in for more gains from here as it has its sights set on the top of an ascending channel forming on the daily time frame.
- The $1400 handle could serve as near-term resistance as it lines up with the channel top and technical indicators are suggesting rally exhaustion.
Bitcoin price could push for more gains as bulls remain in control but profit-taking could happen around the $1400 area.
Technical Indicators Signals
The 100 SMA is above the longer-term 200 SMA so the path of least resistance is to the upside. Also the gap has been pretty consistent, reflecting buying momentum that could take bitcoin price up to the channel resistance at the $1400 mark. A pullback could last until the 100 SMA support at $1100 or to the 200 SMA dynamic inflection point closer to the channel bottom at $950.
Stochastic is already indicating overbought conditions so buyers might want to take a break soon. RSI is also in the overbought area, indicating rally exhaustion so profit-taking is possible once these oscillators turn lower. In that case, bitcoin price could dip to the nearby area of interest at $1200 or at the moving average support areas.

Market Events
The cryptocurrency experienced some volatility leading up to the French elections over the weekend and, even though the results spurred risk-taking in most financial markets, bitcoin price has been able to stay afloat. This is probably due to some persistent uncertainties surrounding the next set of polls as a win by Le Pen could still cause a lot of ruckus in the markets next month.
Meanwhile, data from the US has done little to revive dollar strength ever since the currency has taken a hit from weaker speculations of tax reform from the Trump administration being implemented this year. Event risks for the week include central bank statements from Japan and the euro zone, along with preliminary Q1 2017 GDP readings from the UK and the US.
Charts from SimpleFX


