Bitcoin Price Key Highlights
- Bitcoin price reached yet another all-time high but this was followed by a sharp selloff.
- This sudden drop was attributed to profit-taking since the digital currency has been setting one record high after another for the most part of this week.
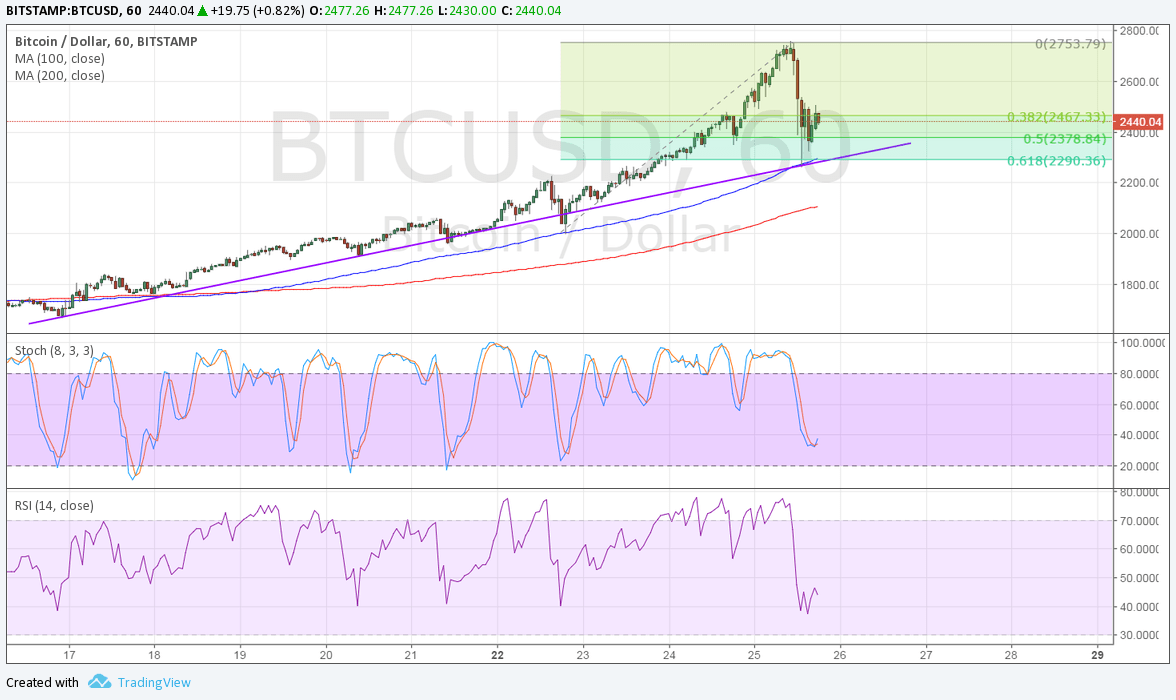
- The uptrend on the 1-hour time frame is still holding and technical indicators are signaling that another move north is in the cards.
Bitcoin price underwent a much-needed pullback from its recent rallies but looks intent to resume the climb soon.
Technical Indicators Signals
The 100 SMA is safely above the longer-term 200 SMA on this time frame so the path of least resistance is still to the upside. In addition, the short-term moving average lines up with the ascending trend line connecting the lows of bitcoin price since the middle of May, adding to its strength as support.
Also, the 61.8% Fib based on the latest swing low and high lines up with this trend line and area of interest. It appears to have kept losses in check and could continue to hold as a floor, pushing bitcoin price back up to the swing high around $2750 later on.
Stochastic is still on the move down to show the presence of selling pressure, but the oscillator appears to be turning higher without even hitting the oversold region. Similarly, RSI seems to be pulling up from its southbound move, suggesting that buyers are eager to get back in the game.

However, if a break below the trend line support happens, bitcoin price could still find support at the 200 SMA dynamic inflection point and uptrend lines visible on longer-term charts.
After all, market factors remain strongly in support of bitcoin price for the time being, particularly when it comes to industry developments and geopolitical risk. Just last weekend, developers and miners agreed on a scaling solution that puts “hard fork” fears to rest. Meanwhile, the terror threat in the UK is keeping investors on edge and on the hunt for alternative assets with higher returns.


