Bitcoin Price Key Highlights
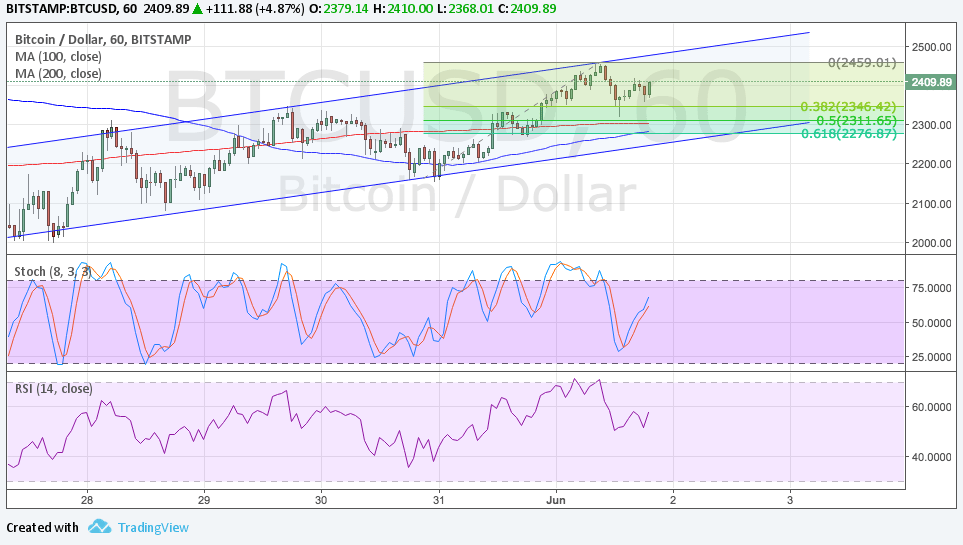
- Bitcoin price is still trading safely inside its ascending channel on the 1-hour chart.
- Resistance at the top of the channel held as expected so bitcoin price is now on its way back to test support.
- Applying the Fib tool on the latest swing low and high shows that the 61.8% level lines up with the bottom of the channel.
Bitcoin price seems to be in the middle of a correction to the ascending channel visible on the short-term charts before heading back up.
Technical Indicators Signals
The 100 SMA is below the longer-term 200 SMA on this time frame so the path of least resistance is to the downside. However, the gap between the moving averages is narrowing to indicate a slowdown in bearish momentum and a potential upward crossover.
Bitcoin price already appears to have bounced off the mid-channel area of interest around $2350. In that case, it could make its way back to the top around $2500 or higher.
Stochastic is pointing up to show that buyers are in control of bitcoin price action. However, RSI is on the move down so price might follow suit and go for a larger correction to the area of interest. Not only is $2300 around the channel support but it also acted as resistance in the past.

Market Factors
News that one of the top bitcoin exchanges in China is once again allowing withdrawals for clients led to a pop higher for bitcoin as this eased concerns of regulatory restrictions in the country. This could also signal that authorities are taking a softer stance on bitcoin and might even officially recognize its legitimacy just as in Japan.
The main event risk for the dollar today is the NFP report as a stronger than expected read could revive dollar strength and a faster pace of tightening for the Fed. Keep in mind, however, that traders are more sensitive to inflation reports these days since Fed policymakers are waiting for more signs of progress on this front.


