Bitcoin Price Key Highlights
- Bitcoin price seems to be having trouble sustaining its climb, as it started forming lower highs so far this week.
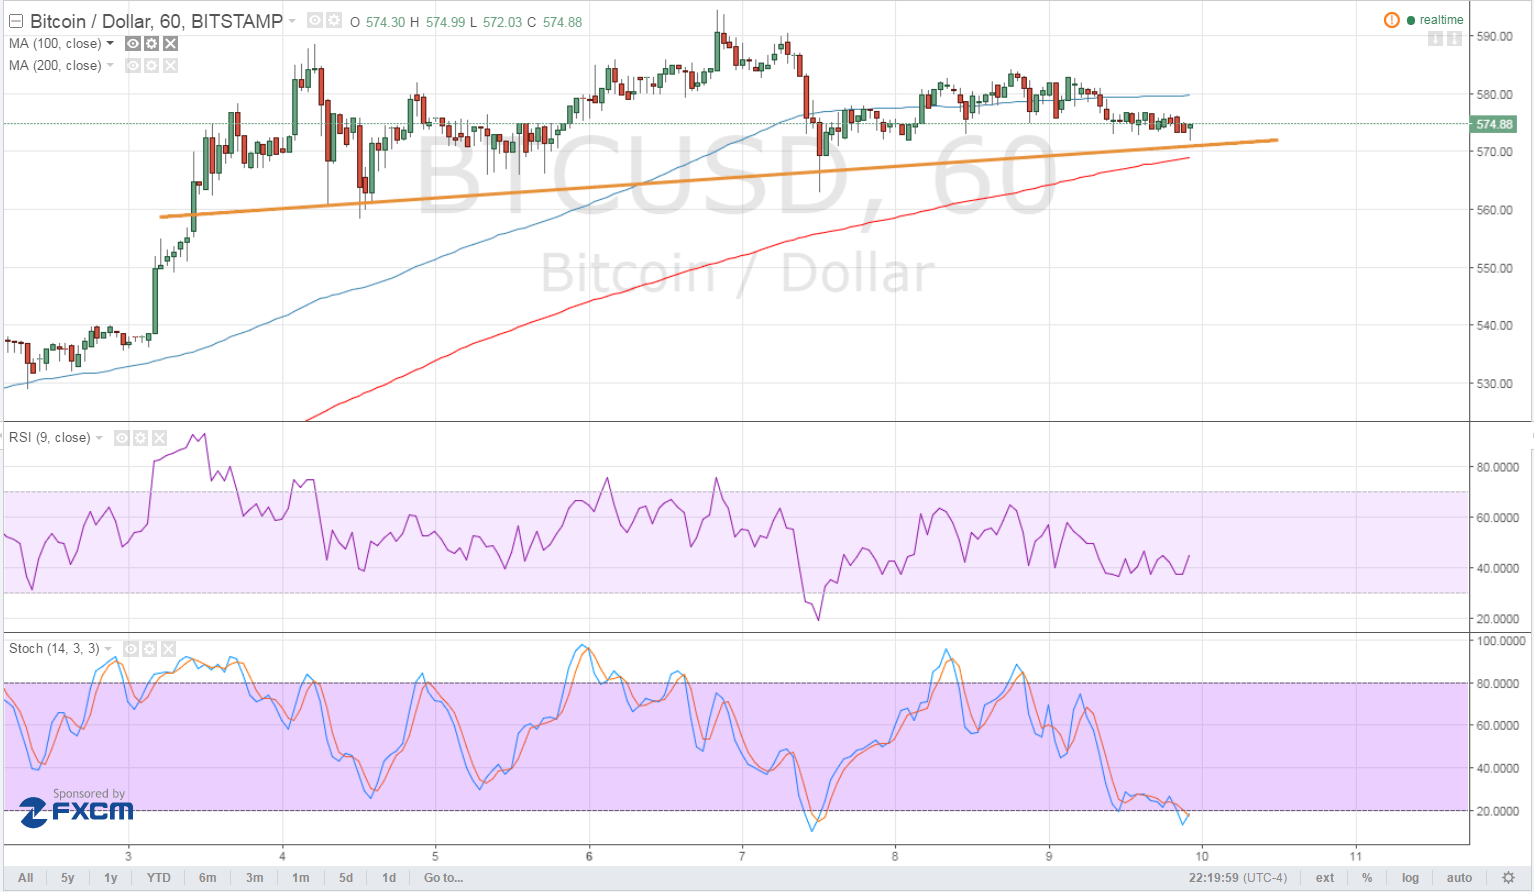
- A head and shoulders pattern seems to be forming, indicating a potential reversal if price breaks below the neckline around $570.
- If that happens, bitcoin price could drop to the next visible support around $540.
Bitcoin price might be in for a larger drop based on the short-term reversal formation but technical indicators are giving a different signal.
Technical Indicators Signals
The 100 SMA is above the 200 SMA so the path of least resistance is still to the upside. This suggests that the rising support level around $570 might serve as a floor, especially since it lines up with the 200 SMA dynamic support.
RSI is pointing up and might be ready to head north so bitcoin price could follow suit. Stochastic is indicating oversold conditions so sellers might need to take it easy from here and allow buyers to take control. If so, bitcoin could head back to the latest highs at $595.

Market Events
The weak NFP report has weighed on the US dollar at the start of June, leading traders to price in lower odds of Fed tightening this month or the next. However, the safe-haven currency has managed to regain ground at the start of this week, possibly as risk-off vibes have remained in the financial markets.
For one, the looming EU referendum could have traders flocking to other fiat currencies such as the US dollar and away from European currencies. Still, other investors might be more interested to move their funds to alternative assets like bitcoin and other virtual currencies, which are not influenced by monetary authorities.
In addition, downbeat CPI results from China could once again spur speculations of yuan devaluation and drive more Chinese investors towards bitcoin. Recall that these factors were one of the main reasons for the sharp surge in bitcoin in late May. The FOMC statement next week could be crucial for determining dollar direction and therefore bitcoin price action so be on the lookout for potential breakouts or rallies.
Charts from TradingView


