Bitcoin Price Key Highlights
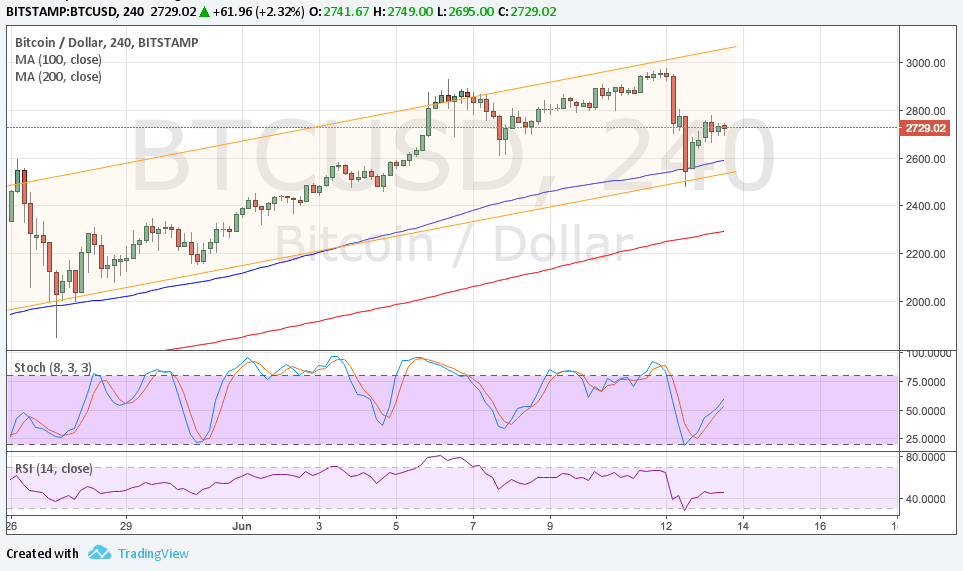
- Bitcoin price is trading inside an ascending channel on its 4-hour chart and has just bounced off support.
- A climb to the channel resistance around the $3000 mark could be underway.
- Technical indicators are also suggesting that the uptrend is likely to resume at this point.
Bitcoin price sold off sharply recently but has found support at the bottom of the ascending channel on its 4-hour time frame.
Technical Indicators Signals
The 100 SMA is above the longer-term 200 SMA on the 4-hour time frame, signaling that the path of least resistance is to the upside. In other words, the uptrend is more likely to resume than to reverse. Also, the 100 SMA held as dynamic support since it lined up with the bottom of the channel.
Stochastic has pulled up from the oversold area to reflect a return in buying pressure and has a long way to go before hitting the overbought zone. This means that there’s enough bullish momentum left for more gains in bitcoin price.
RSI is also heading north so bitcoin price might follow suit. Stronger bullish pressure might even lead to a break past the channel resistance and the creation of new highs. On the other hand, a return in selling momentum could lead to a dip to the 200 SMA dynamic inflection point at $2300.

Market Factors
Dollar volatility could come into play for the upcoming trading sessions as the FOMC is scheduled to announce its monetary policy decision. An interest rate hike of 0.25% is widely expected but traders are more interested to find out if more tightening moves are in the cards or not. Increased focus on balance sheet adjustments could lower the odds of a September hike.
Meanwhile, bitcoin price seems to be recovering along with U.S. market gains as the tech rout appears to have passed. However, the return in risk appetite may also draw funds away from cryptocurrencies and onto rallying stocks and commodities.


