Bitcoin Price Key Highlights
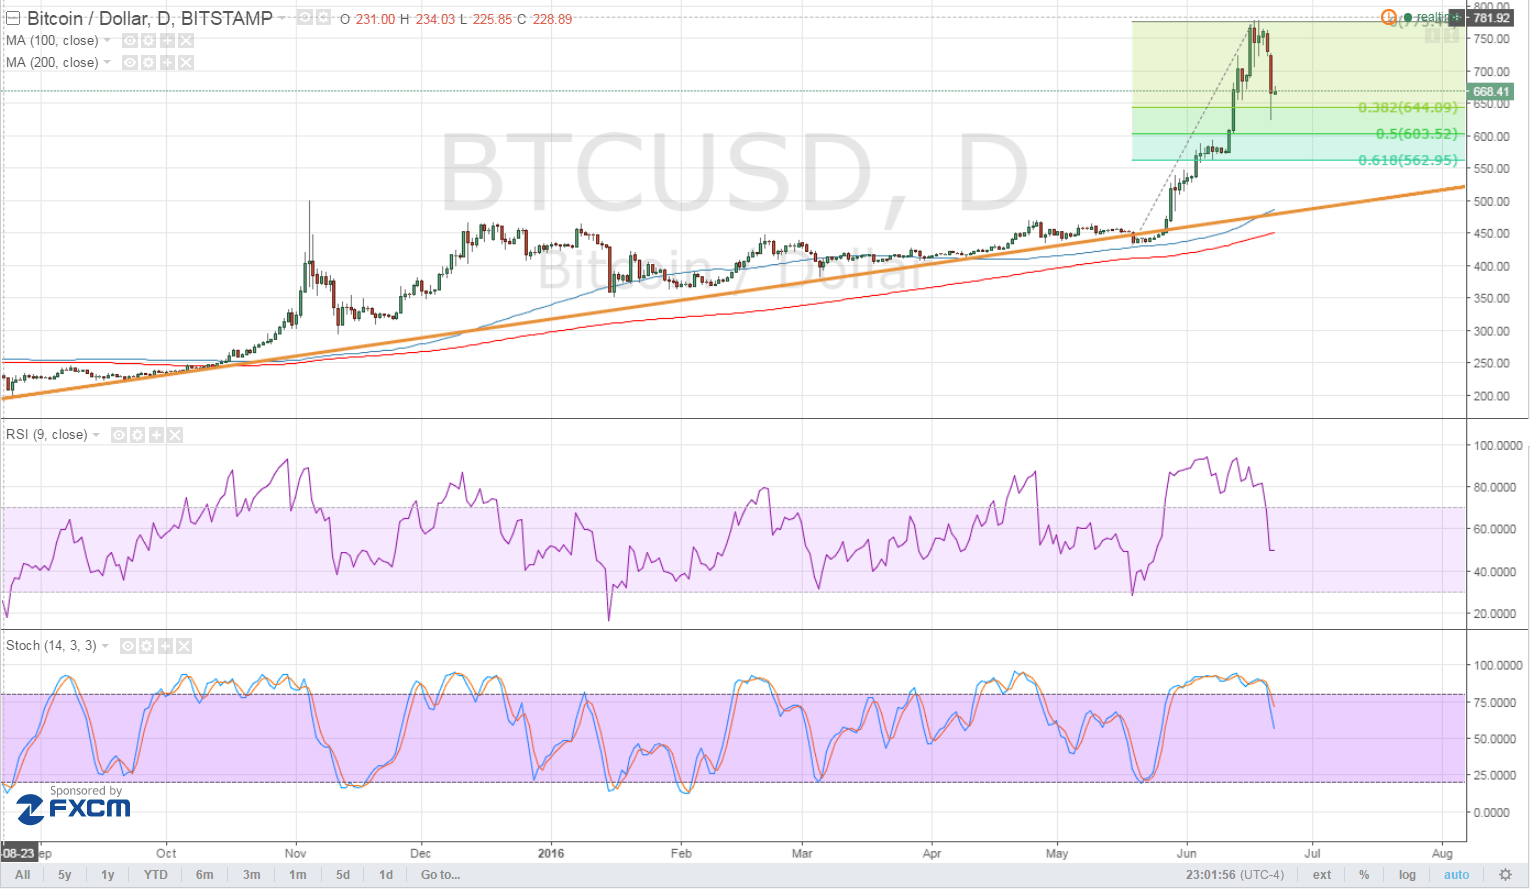
- Bitcoin price is still selling off, moving towards the 38.2% Fib or the $650 area as predicted in the previous article.
- Price appears to have found a bit of support at this area, forming a long spike after the test and still deciding whether to resume the climb or to make a larger pullback.
- Technical indicators appear to be suggesting that the correction is still far from over.
Bitcoin price is finding support at the 38.2% Fibonacci retracement level but a larger pullback might be due.
Technical Indicators Signals
The 100 SMA is above the 200 SMA so the longer-term uptrend is likely to carry on. The gap between the moving averages is still narrow but appears to be growing so bullish pressure might be strengthening. In addition, the 100 SMA coincides with the rising trend line on the daily time frame, which might hold as dynamic support.
However, RSI is still pointing down, which means that sellers are in control for now. Stochastic is just making its way out of the overbought region, indicating a buildup in bearish momentum. In that case, bitcoin price could move on to the next area of interest closer to the 61.8% Fib or $550. A bounce off this level could allow the climb to resume to the latest highs at $776.

Market Events
The EU referendum is set to take place tomorrow and with polls suggesting a widening margin in favor of the remain camp, investors are starting to book profits off this “uncertainty trade” on bitcoin. Recall that traders were forced out of equities and currencies in anticipation of additional uncertainty if the UK were to leave the EU, but opinion polls seem to be hinting that this scenario can be avoided.
Once this event risk has passed, though, bitcoin demand could remain supported by outflows from China. Keep in mind that Chinese investors have moved a lot of funds into bitcoin in anticipation of a weaker yuan and capital controls, leading to the strong upside breakout in late May. Should this phenomenon persist, bitcoin price might still be looking at further upside.
Charts from TradingView


