Bitcoin Price Key Highlights
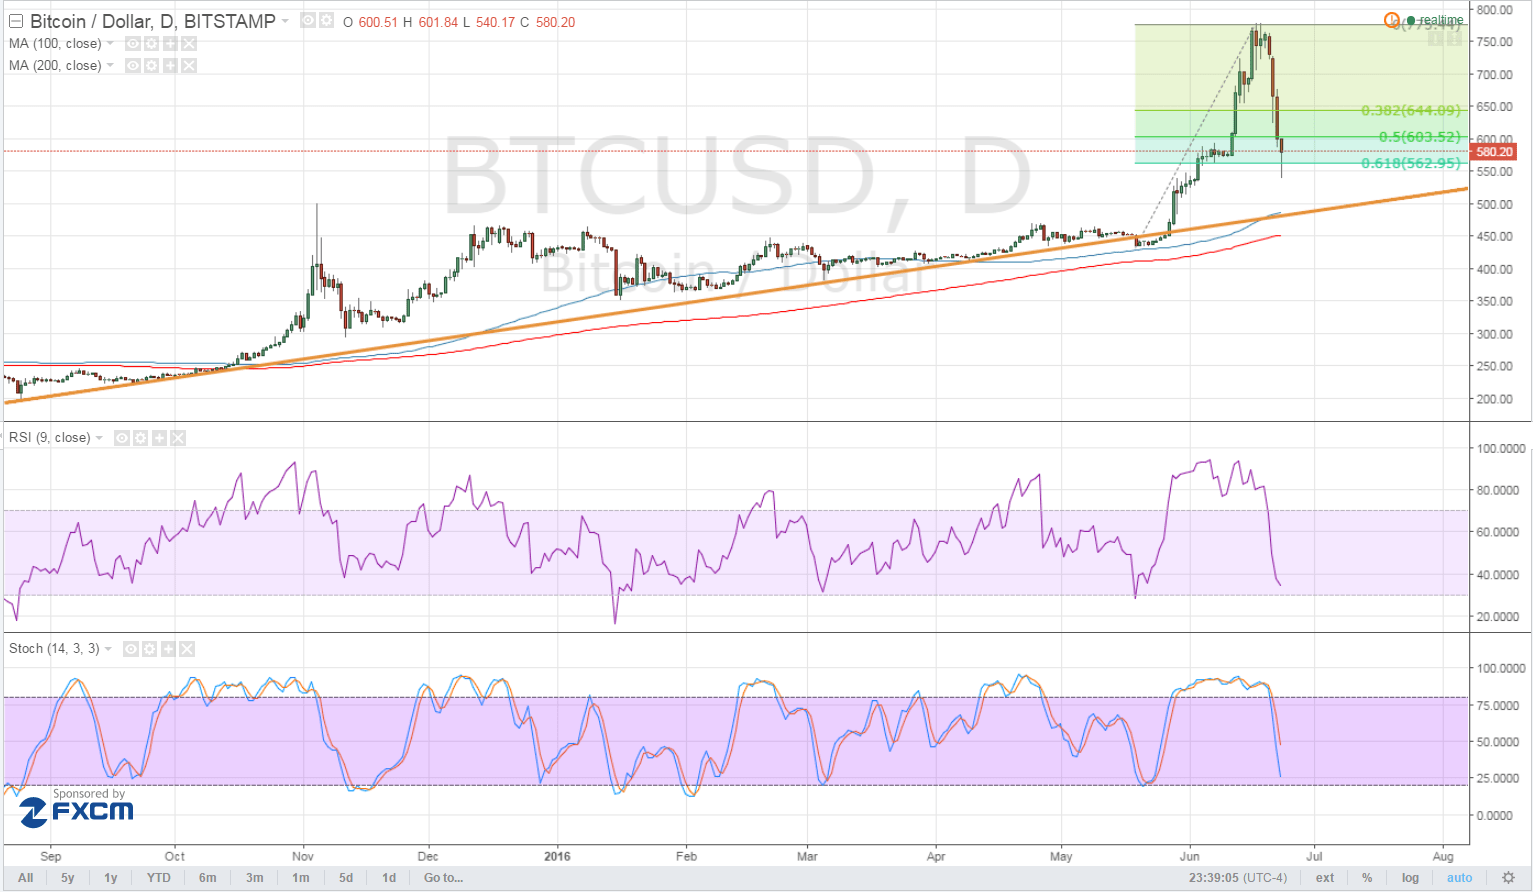
- Bitcoin price is still in correction mode, moving on to the lowest Fib on it daily time frame.
- Price appears to be finding support at the 61.8% Fibonacci retracement as a long spike formed.
- If bulls get back in the game, bitcoin price could resume its climb to the swing high at $775.
Bitcoin price is still pulling back from its recent strong rallies, moving closer to the rising trend line on the daily chart.
Technical Indicators Signals
The 100 SMA is still above the 200 SMA for now, confirming that the uptrend is likely to carry on. However, RSI and stochastic are both on the move down so bitcoin price could keep heading south as bears stay in control.
A larger selloff could last until the rising trend line connecting the lows on the daily time frame. This lines up with the 100 SMA, which might hold as a dynamic support level. It also coincides with a former resistance level that could now hold as support around $450-500.
For now, profit-taking appears to be in play while risk appetite has shown a return in other financial markets. Traders might be booking their gains on their recent risk-off positions now that the EU referendum is set to start.

Market Events
The much-anticipated EU referendum is set to start in a few hours and the recent price action seems to suggest that traders might stay out of the markets due to unprecedented volatility. The official results won’t be out until the Asian session on Friday but private exit polls could give an idea of how the vote might turn out.
Bitcoin price could resume its climb if the UK votes to exit the EU since this would bring a lot of financial and economic uncertainty even for the global economy. This could once again discourage traders from putting money in equities and currencies, giving rise to the “uncertainty trade” of going long bitcoin and other virtual currencies.
On the other hand, a vote to stay in the EU could foster more calm and lead traders back to traditional markets once more, possibly even leading to a downside break of the daily trend line.
Charts from TradingView


