Bitcoin Price Key Highlights
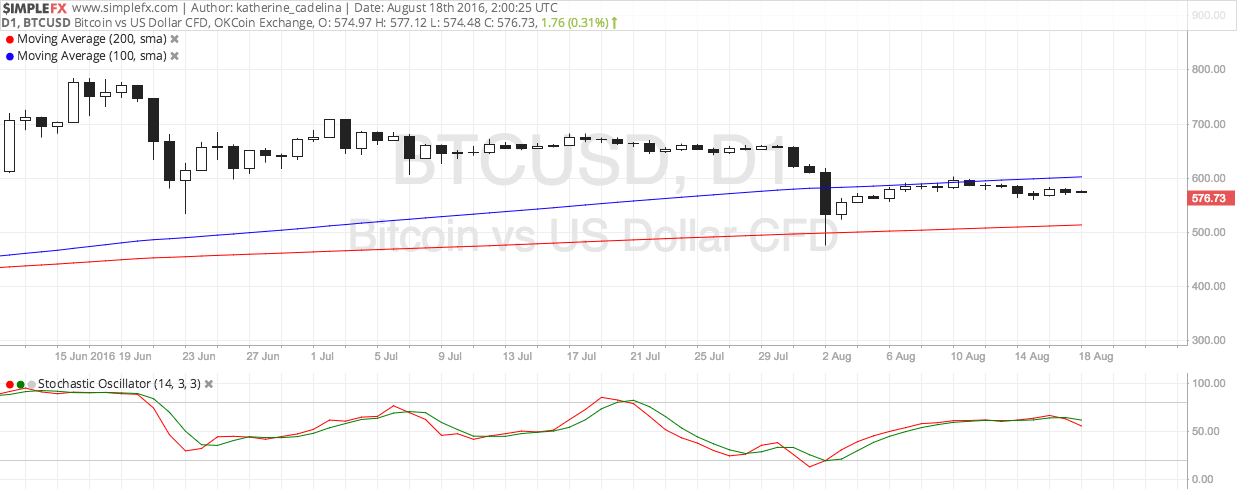
- Bitcoin price is trading in a downtrend, moving below a descending trend line on its daily time frame.
- Price is gearing up for a test of the trend line and could be ready to resume the selloff soon.
- However, technical indicators are suggesting that buying pressure might still be present.
Bitcoin price is pulling up from its slide but might be ready to trend lower upon testing the resistance.
Technical Indicators Signals

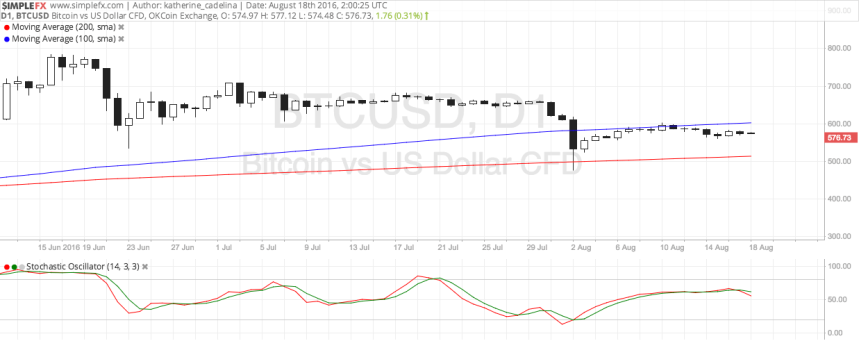
The 100 SMA is still above the longer-term 200 SMA so the path of least resistance could still be to the upside. In that case, a break past the trend line resistance might be a possibility.
At the same time, stochastic is still heading north, which means that bullish momentum is in play, possibly enough to carry bitcoin price up to to the trend line. Sustained bullish pressure could spur an upside break and a reversal from the downtrend, but it would take a strong market catalyst to trigger that.
If the trend line holds as resistance, bitcoin price could resume its drop to the next long-term support at the lows around $500 or perhaps even create new lows.
Market Events
The FOMC minutes turned out to be bearish for the US dollar since the policymakers didn’t sound as hawkish as many expected. Following FOMC member Bullard’s cautious remarks in his testimony, the minutes showed that policymakers are in no rush to hike interest rates for the remainder of the year.
Most members agreed that it would be prudent to accumulate more data first before making any policy adjustments. With that, traders lightened their long dollar positions across the board, leading to a corresponding boost in bitcoin price in the process.
However, the US dollar remains the preferred safe-haven in the markets and any signs of a slowdown could still draw traders back to the dollar and away from the riskier and higher-yielding bitcoin.
Charts from SimpleFX


