Bitcoin Price Key Highlights
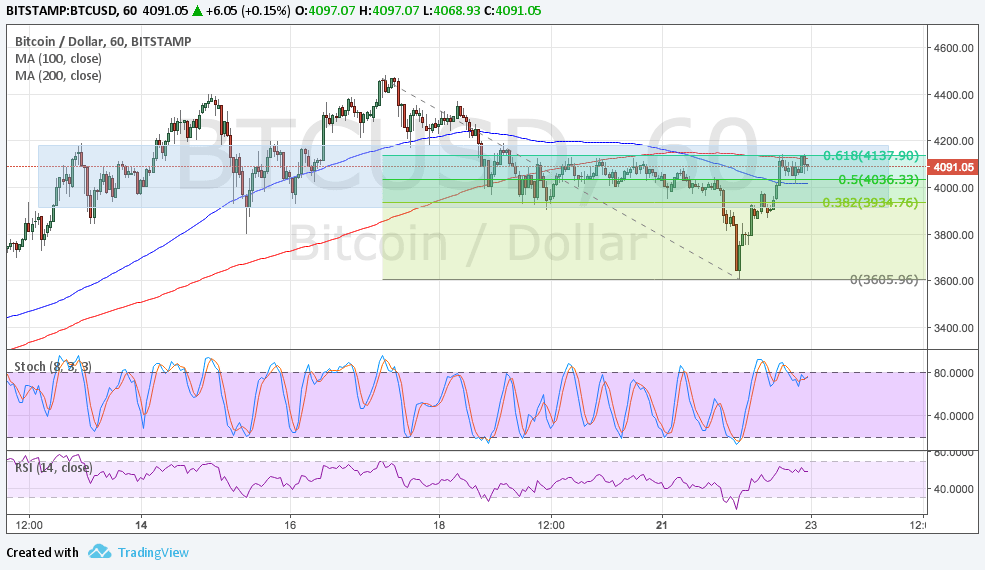
- Bitcoin price recently broke below support around the $4000 level and dipped to $3600.
- Price bounced right back up to the broken support area, which might hold as resistance from here.
- Applying the Fib tool on the latest swing high and low shows that this area lines up with the 61.8% retracement level.
Bitcoin price is in correction mode after the latest drop and sellers might be ready to hop back in from here.
Technical Indicators Signals
The 100 SMA is below the longer-term 200 SMA to indicate that the path of least resistance is to the downside. In addition, the 200 SMA is holding as dynamic resistance since it lines up with the 61.8% Fibonacci retracement level around $4137.
Stochastic has reached the overbought zone and is starting to turn lower to reflect a return in selling pressure. RSI has room to head north to show that bullish pressure remains but it also looks ready to head south, so bitcoin price might follow suit. In that case, a move towards the $3600 mark could take place.

Market Factors
Bitcoin price was weighed down by reports indicating that bitcoin cash has gained more mining power, which means that it is becoming a more viable rival to the core version. This could give rise to complications regarding the upgrade to SegWit and keep incompatibility concerns in play.
However, the return in risk aversion has boosted the cryptocurrency as traders generally seek higher returns in alternative markets during these cases. The start of the joint military exercises between the US and South Korea is being seen as an act of provocation by North Korea, leading some to worry that Pyongyang will push through with its plan to launch a missile strike on Guam.
Other potential catalysts include Fed head Yellen’s speech during the Jackson Hole Symposium as many expect her to drop some hints on the Fed’s policy plans and the balance sheet runoff date.


