Bitcoin Price Key Highlights
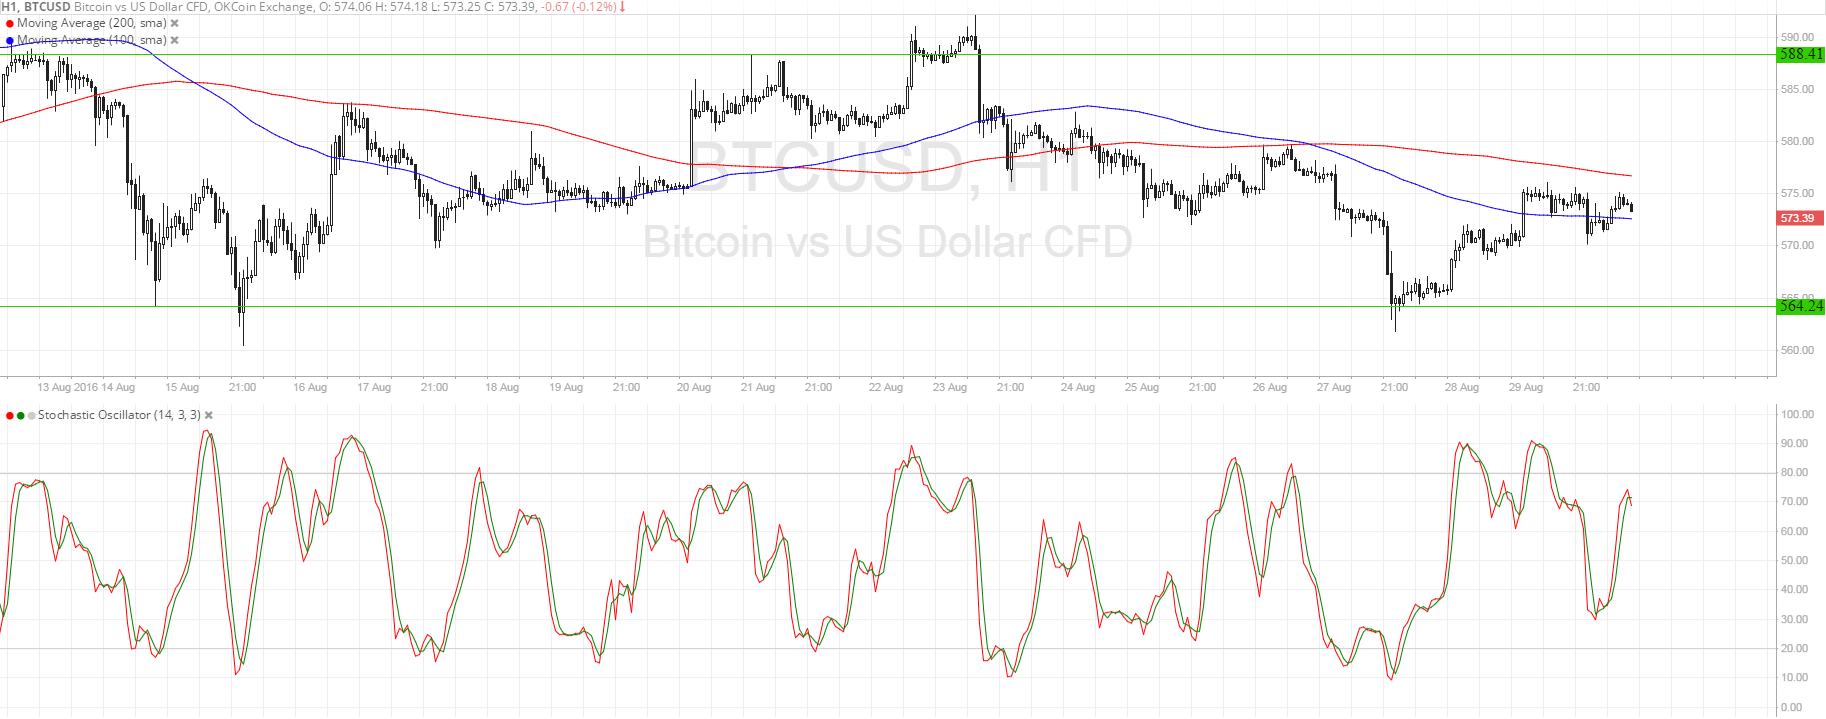
- Bitcoin price has been moving sideways recently, bouncing off support at $565 and finding resistance at $585.
- Price is in the middle of its range for now and may be encountering a bit of resistance at the area of interest.
- A break above the moving averages could put it on track towards testing the range resistance once more.
Bitcoin price is stuck in consolidation, stalling at the middle of its range and still deciding whether to make a test of resistance or not.
Technical Indicators Signals
The moving averages are oscillating, which suggests that the range-bound bitcoin price action could continue. At the moment, price is treading around the dynamic inflection points, still trying to find momentum in either direction.
The 100 SMA is below the 200 SMA so the path of least resistance could still be to the downside. The short-term moving average also appears to be holding as dynamic resistance for now, although a rally could still find a ceiling at the 200 SMA.
If so, bitcoin price could make another test of support, with stronger bearish pressure likely to trigger a break lower. Stochastic seems to be on the move up but is starting to turn lower again, hinting at a potential return in selling momentum.

Market Events
Dollar strength has been in play in the financial markets recently, following Fed Chairperson Yellen’s hawkish remarks during the Jackson Hole Symposium. However, this has also led some investors to pursue higher returns in alternative assets such as bitcoin, leading them to move funds away from commodities and equities.
Market watchers are still waiting to see stronger data from the US to confirm that the Fed could stay on its tightening path, possibly keeping hopes up for a rate hike in September or December this year. For this week, the spotlight is on the jobs sector as the NFP is due on Friday.
Intraday bitcoin price action against the dollar could then be influenced by leading employment data such as the ADP report and ISM PMI readings.
Charts from SimpleFX


