Bitcoin Price Key Highlights
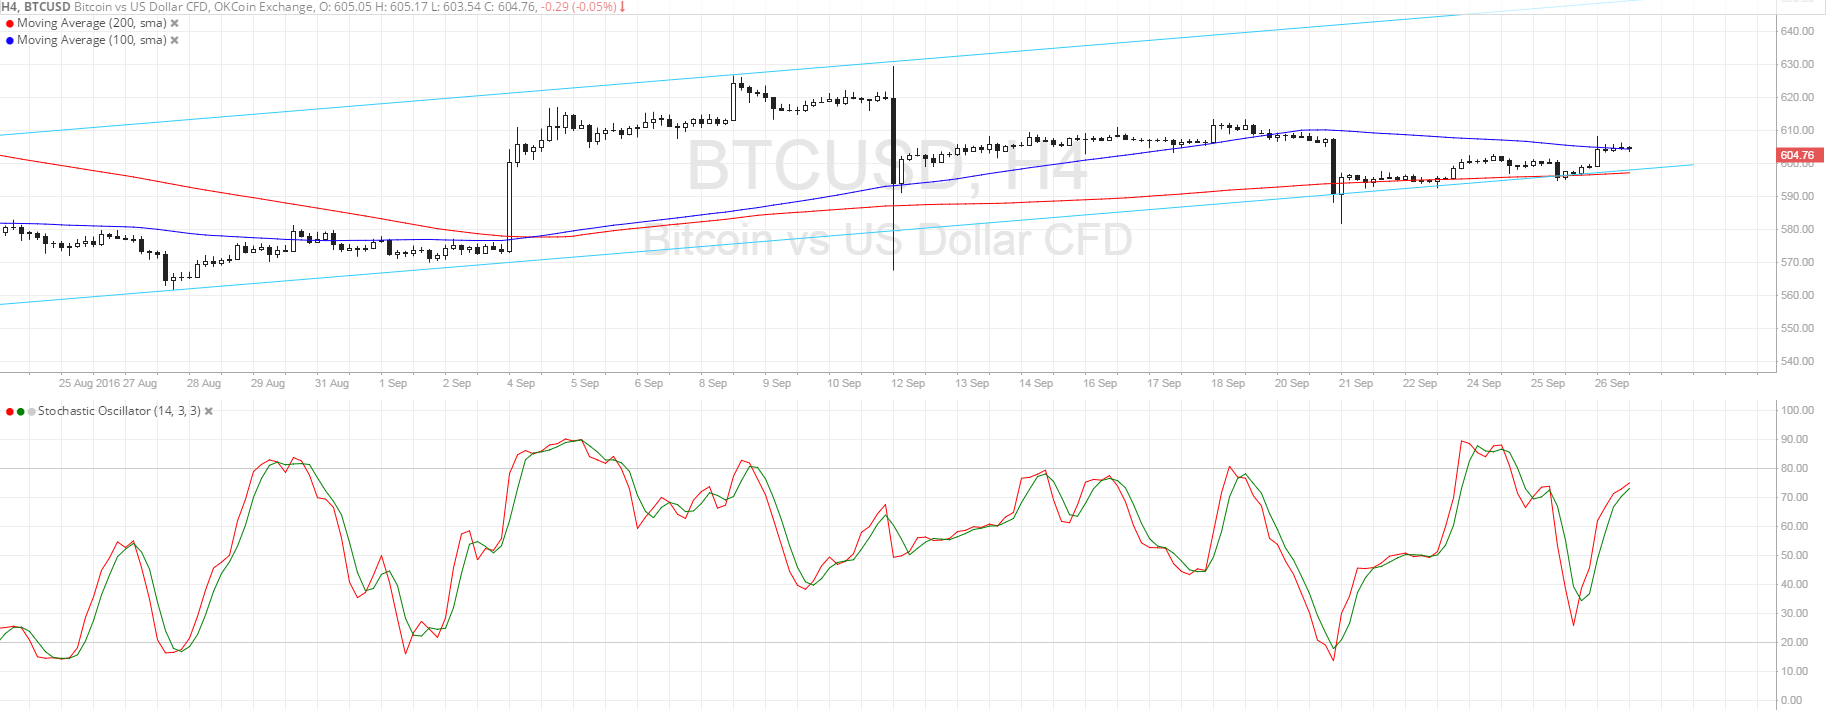
- Bitcoin price is still hovering around the bottom of the ascending channel on its 4-hour time frame.
- Bullish momentum seems to be returning as price made a more convincing bounce and is in a continuation pattern.
- A bullish flag pattern has formed after the recent sharp rally, and a break past this formation could seal in more gains.
Bitcoin price looks ready to resume its climb as the ascending channel support is still holding.
Technical Indicators Signals
The 100 SMA is still above the longer-term 200 SMA, indicating that the path of least resistance is to the upside. The short-term moving average is holding as dynamic resistance for now but a break past this $605 level could confirm that bulls are taking control of bitcoin price action.
The gap between the moving averages is narrowing, though, so a downward crossover could be imminent. If it does materialize, bitcoin price could make another attempt at breaking below the ascending channel support at $600.
Stochastic is still on the move up so buyers are on top of their game. The oscillator is already nearing the overbought zone so buying pressure could be exhausted soon. In that case, sellers could regain control and push for a reversal from the uptrend.

Market Events
The US presidential debate seems to be dominating the headlines so far this week, bringing an additional factor of uncertainty to the mix. US equities have ended Monday lower, reflecting how investors are shying away from putting money in US securities ahead of this event risk.
There’s not much in the way of US economic reports anyway, although the new home sales for August printed a slightly higher than expected read. The CB consumer confidence index is due today and a slip in optimism is eyed, with a sharper than expected fall likely to take a bigger chunk out of the dollar’s gains against bitcoin.
Keep in mind also that the end of the week, month, and quarter is approaching so there’s a strong chance for profit-taking from the latest bitcoin price move for the period.
Charts from SimpleFX


