Bitcoin Price Key Highlights
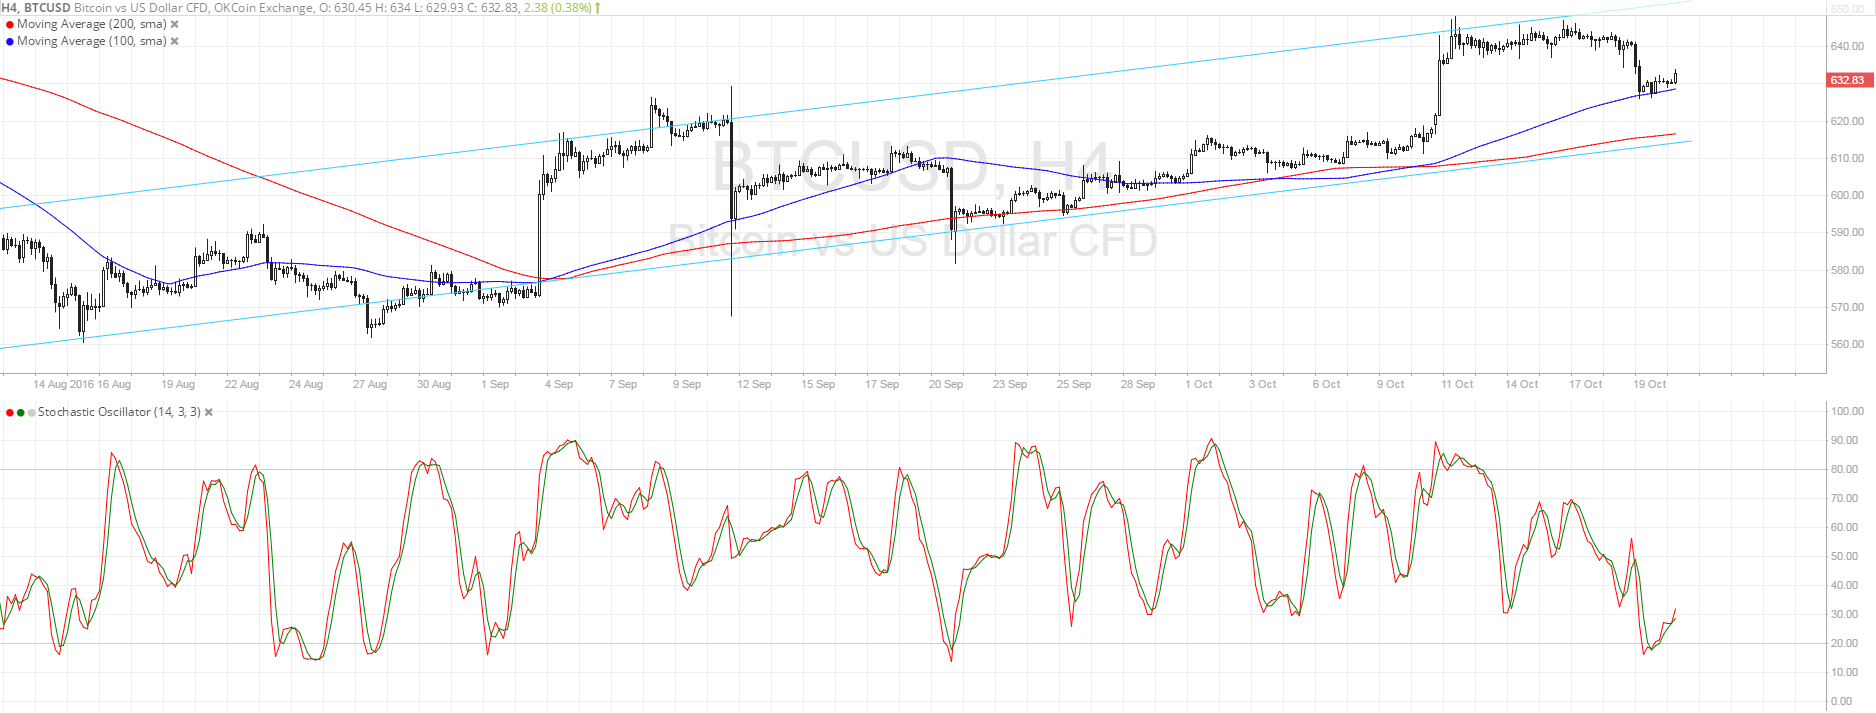
- Bitcoin price continues to trend higher on its 4-hour time frame, still moving inside its ascending channel pattern.
- As shown in an earlier article, bitcoin has found support at a former resistance level and looks ready to resume its rally.
- This area of interest is right in the middle of its longer-term ascending channel.
Bitcoin price could make another move towards the top of its channel since bulls have been waiting to charge at this area of interest.
Technical Indicators Signals
The 100 SMA is above the longer-term 200 SMA on this time frame, which means that the path of least resistance is to the upside and that the climb could carry on. The short-term moving average is even holding as dynamic support for the time being, but a larger pullback could find a floor at the 200 SMA closer to the channel support.
Stochastic is already pulling out of the oversold area to indicate a return in buying pressure. This might be enough to take bitcoin price up to the resistance at $650 or higher. On the other hand, a sudden return in selling pressure or a strong dollar rally could trigger a downside break of support and a move towards the next floor at $580-600.

Market Events
There’s not much in the way of US market catalysts so bitcoin price moves could hinge mostly on market sentiment. So far, the European Central Bank and the Bank of Canada are keeping a dovish stance and have shared a less upbeat outlook for the respective economies. This has been supporting the safe-haven US dollar these days, especially since the Fed remains on track towards hiking rates before the end of the year.
Keep in mind, however, that volatility usually picks up for bitcoin price at the end of the week likely due to traders booking profits or reestablishing their positions in reaction to headlines over the weekend. Next week promises another data-light schedule so it could be all about overall market sentiment and a continuation of the bitcoin trend.
Charts from SimpleFX


