Reason to trust

How Our News is Made
Strict editorial policy that focuses on accuracy, relevance, and impartiality
Ad discliamer
Morbi pretium leo et nisl aliquam mollis. Quisque arcu lorem, ultricies quis pellentesque nec, ullamcorper eu odio.
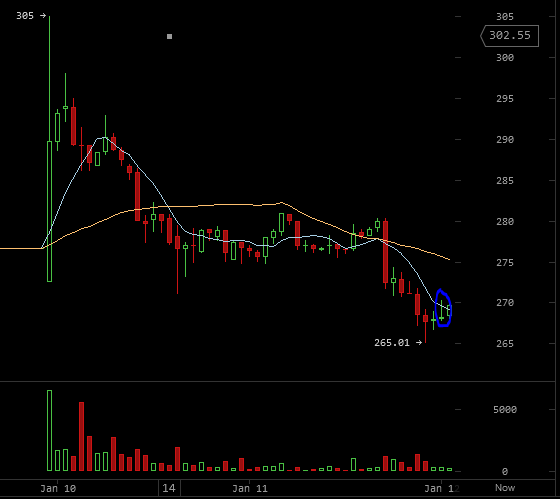
The market drove the price of Bitcoin downwards yesterday, until it touched the $265 line and then started rising until reaching $270 at the time of writing of this article.
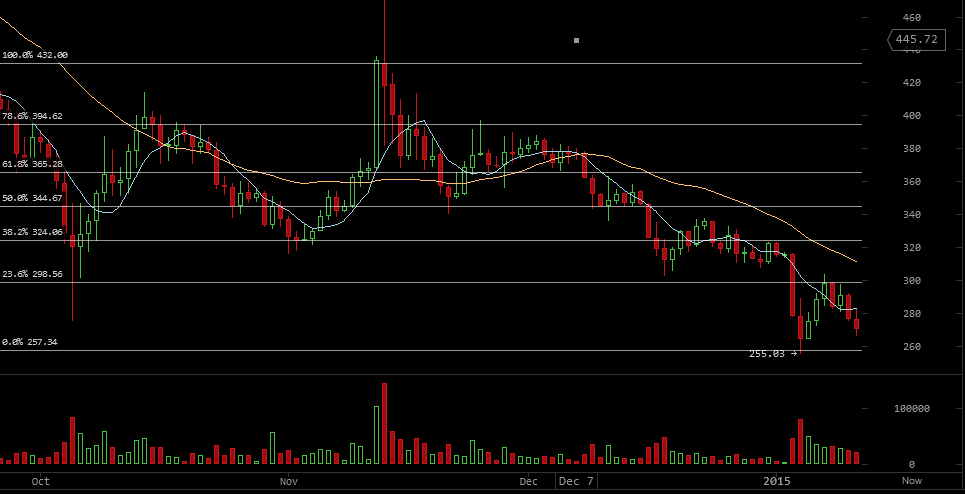
By drawing a trend line with between the high reached on the 12th of November, 2011 ($432) and the low reached on the 4th of January ($257) and plotting Fibonacci retracements on the below chart, we can conclude the following:
- If the price fell below $255 which is the support point and the low reached on the 4th of January, the market is likely to drive the price to decline even more to $201, which is the next support point, according to historical charts.
- If the price cannot break the $255 support point and rises up, it will face resistance at $298, which is the 23.6% point according to the Fibonacci retracements. If the market’s buying power is strong enough to break the resistance at $298, it is likely to continue rising until reaching resistance at $324, which is the 38.2% point, according to the Fibonacci retracements, we plotted earlier
The volatility is now very high, and the price is likely to move sideways to the $255, before heading downwards, or going upwards. So, it is advisable to remain cautious and limit long positions, until the resistance at $298 is tested. The “shooting star” (blue circle on the above chart) might mean that the price is facing resistance and is more likely to continue falling.


As long as I’m awake when these articles get posted, I’m going to make sure people see that there’s at least one tip on them already. Maybe they’ll get the hint and follow my lead. Thanks for the TA. You want to include which moving averages you like to use and why.
Cheers!