Reason to trust

How Our News is Made
Strict editorial policy that focuses on accuracy, relevance, and impartiality
Ad discliamer
Morbi pretium leo et nisl aliquam mollis. Quisque arcu lorem, ultricies quis pellentesque nec, ullamcorper eu odio.
Bitcoin Price Key Highlights
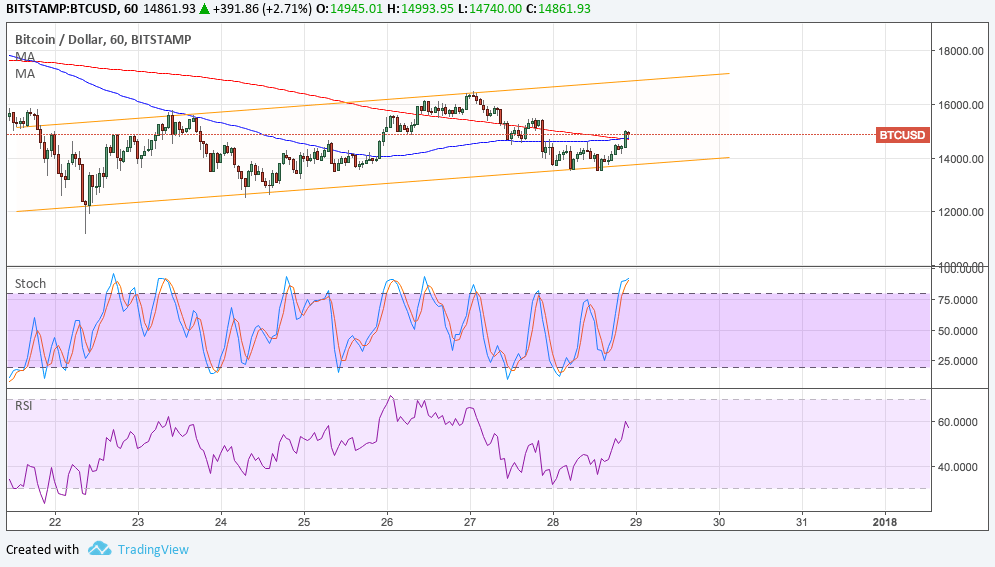
- Bitcoin price appears to be forming a short-term ascending channel on its 1-hour chart.
- Price has bounced off the channel support and might be due for a test of the resistance around $17,000.
- Technical indicators are giving mixed signals, however.
Bitcoin price is starting to trend higher on its 1-hour time frame, but technical indicators still reflect some bearish pressure.
Technical Indicators Signals
The 100 SMA is starting to cross above the longer-term 200 SMA to signal that the path of least resistance is to the upside. If this materializes, more bulls could hop in and push price to the top of the channel and beyond.
However, stochastic is indicating overbought conditions or that buyers are already feeling exhausted. If selling pressure returns, price could make another test of the channel support at $14,000 or even break lower.
RSI has room to climb so bitcoin price might still be able to hold its ground. Once it reaches overbought levels and turns back down, bears could take the upper hand.

Market Factors
Bitcoin price rallies have been limited on reports that South Korea is ramping up its efforts to curb bitcoin trading. Note that the nation takes up one of the top spots in terms of bitcoin activity, so restrictions could mean lower volumes.
This also probably explains why volatility has taken a hit recently. Apart from that, keep in mind that we’re approaching the last few trading days of the year, which means that profit-taking is in play.
Bitcoin’s inability to break past the $20,000 barrier on its latest surge has led to a bout of liquidation that also contributed to the latest tumble. Besides, the dollar has drawn support on the approval of the GOP tax reform package, which could lead to a big boost in business activity and equities in the coming months.
With bitcoin still hovering near record highs and stocks showing more upside, traders could favor this market for the time being.


