The price of Bitcoin started the day by a slight rise from $268 to around $274, before falling again to $268. The price seems to be oscillating today between $268 and $274, as we estimated yesterday that the price is likely to move sideways, as it approaches the $255 support point.
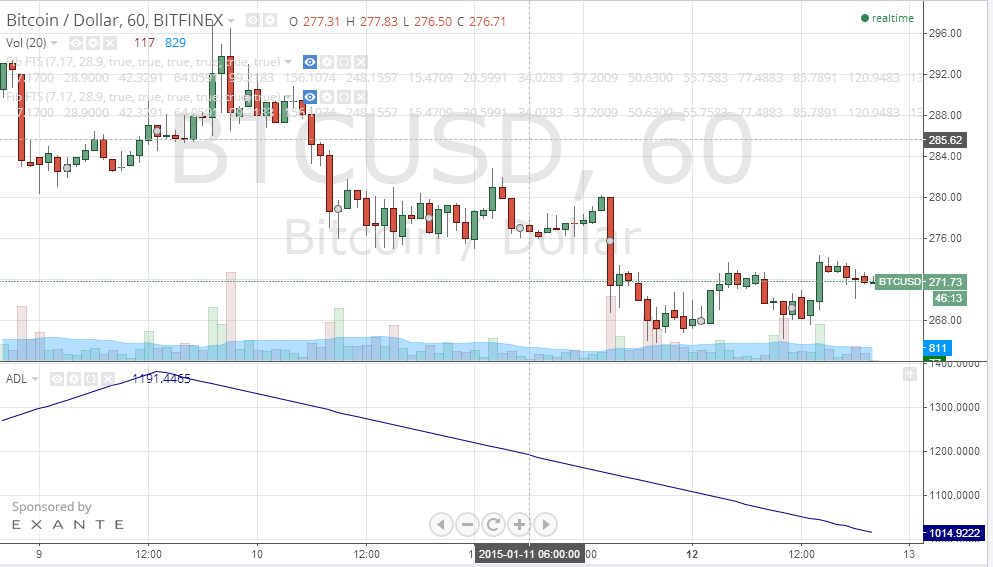
The Advance/Decline line is sloping downwards (look at the below chart) which means that the downtrend is rather strong and is not likely to reverse today. The chart also shows the low trading volume compared to yesterday. If the price is to continue dropping or reverse to the bullish side, a bigger trading volume is crucial.
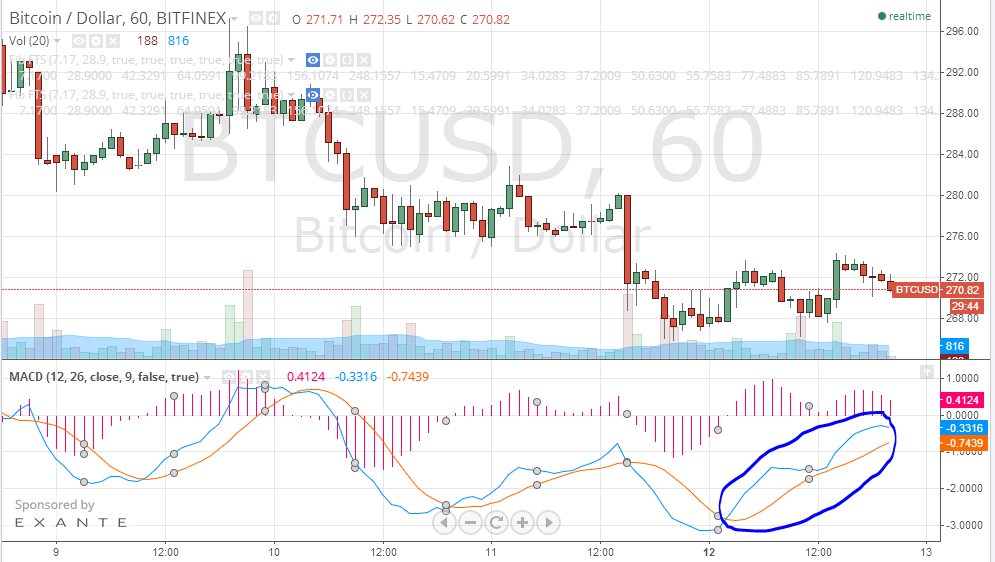
When reviewing the MACD of the Bitcoin/USD 1 hourly chart (look at the below chart), we can see that today started with a crossover between the MACD and the signal line. The MACD line (blue line) came under the signal line (red line) which can mean that the current downtrend is losing strength; however, at such low volumes of trading, such sign can be of minor importance.
My advice for traders is to hold back until the $255 support point is tested. If the price falls below $255, it is likely to drop even more and would only meet support again at the $200 mark. Today’s low trading volume reflects anticipation of speculators who prefer to “wait and see”, rather than test the waters and lose to the market’s high volatility at this point.