Reason to trust

How Our News is Made
Strict editorial policy that focuses on accuracy, relevance, and impartiality
Ad discliamer
Morbi pretium leo et nisl aliquam mollis. Quisque arcu lorem, ultricies quis pellentesque nec, ullamcorper eu odio.
Bitcoin Price Key Highlights
- Bitcoin price seems to be moving sideways recently, possibly establishing its range for the remainder of the year.
- Volatility has been subdued again after the FOMC statement led to a sharp rally for the dollar then a quick reversal.
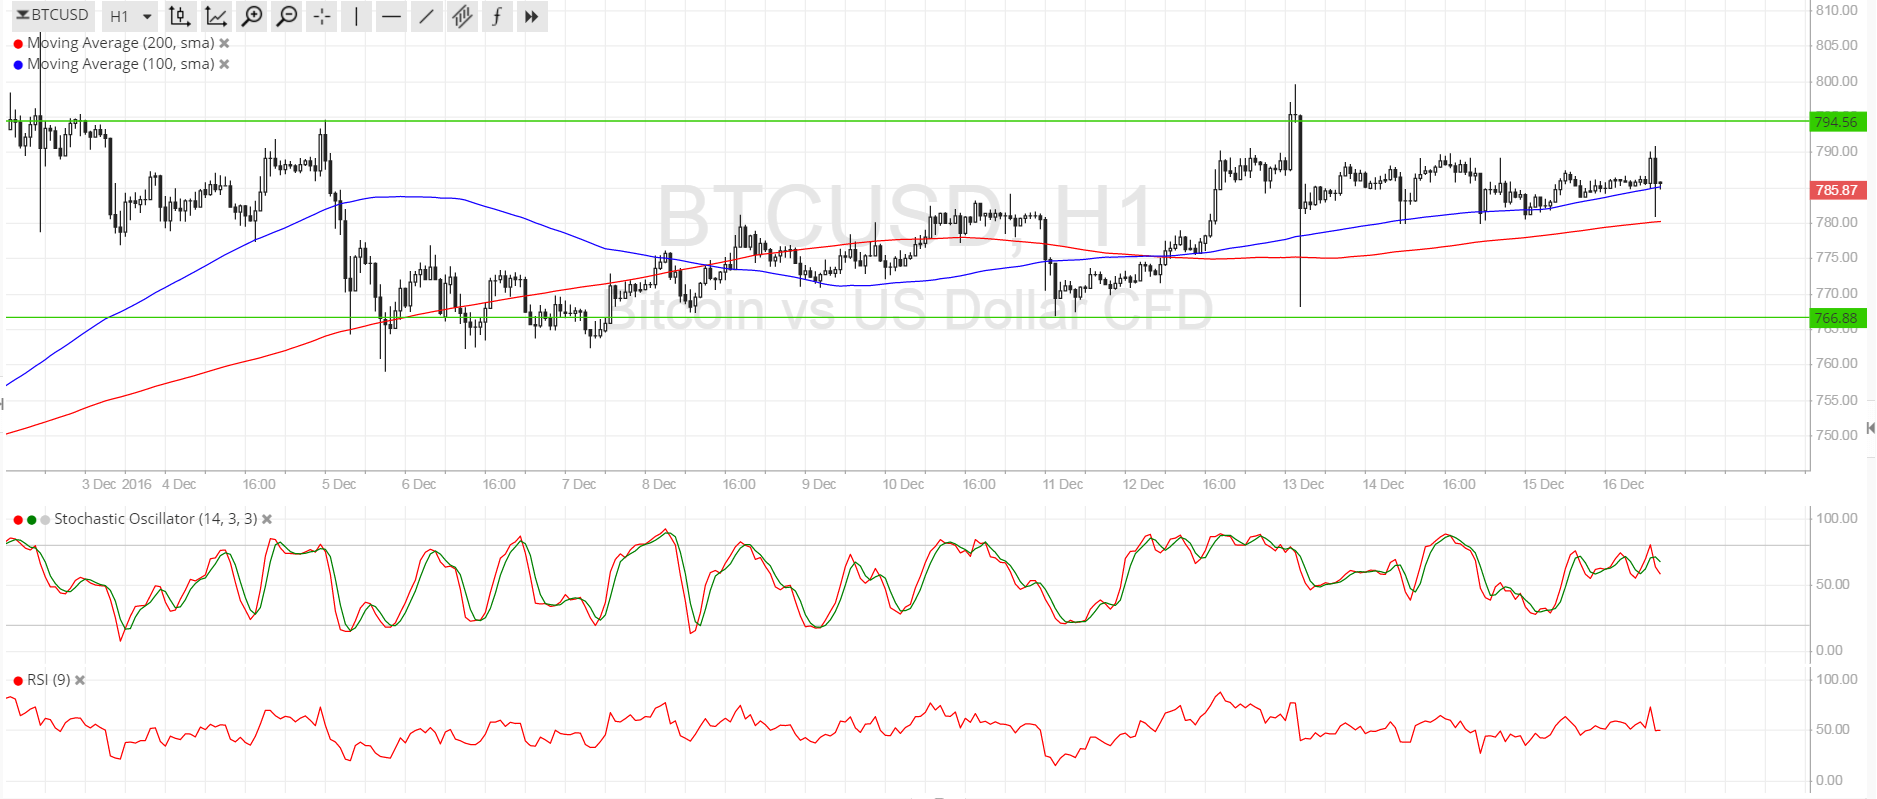
- Bitcoin price found support around $765 and resistance at $795.
Bitcoin price could continue to trade sideways as the Christmas holidays are approaching and volumes might be turned down.
Technical Indicators Signals
The 100 SMA is still above the longer-term 200 SMA so the path of least resistance is to the upside. Bitcoin price is drawing support from the 100 SMA dynamic inflection point right now and could bounce back up to the top of the range. A larger dip could last until the 200 SMA, but a break below this could push price down to the bottom of the range.
Stochastic appears to be turning lower, possibly drawing sellers to the game. RSI is still cruising sideways in the middle of its range so the consolidation could carry on in the absence of strong directional clues. A break either to the upside or downside could lead to a resulting rally or selloff that’s around the same size as the range.

Market Events
It seems that the main market events for the rest of 2016 have already passed so traders are starting to close their positions in order to be able to crunch their profits or losses for the year. This could keep volumes low in bitcoin trading, preventing price from making any significant headway in any direction.
But with the Fed’s decision to hike interest rates and open the door for three more tightening moves next year, dollar strength could still outweigh bitcoin price gains for the time being unless any major updates from China come out. Keep in mind that any moves by authorities to restrict offshore investments or devalue the yuan draws mainland investors to the cryptocurrency, as they seek higher returns or attempt to hedge against the falling value of the local currency.
Barring any significant swings in risk sentiment, bitcoin price could be stuck in this range for the next couple of weeks before resuming its volatile moves next year.
Charts from SimpleFX


