Bitcoin Price Key Highlights
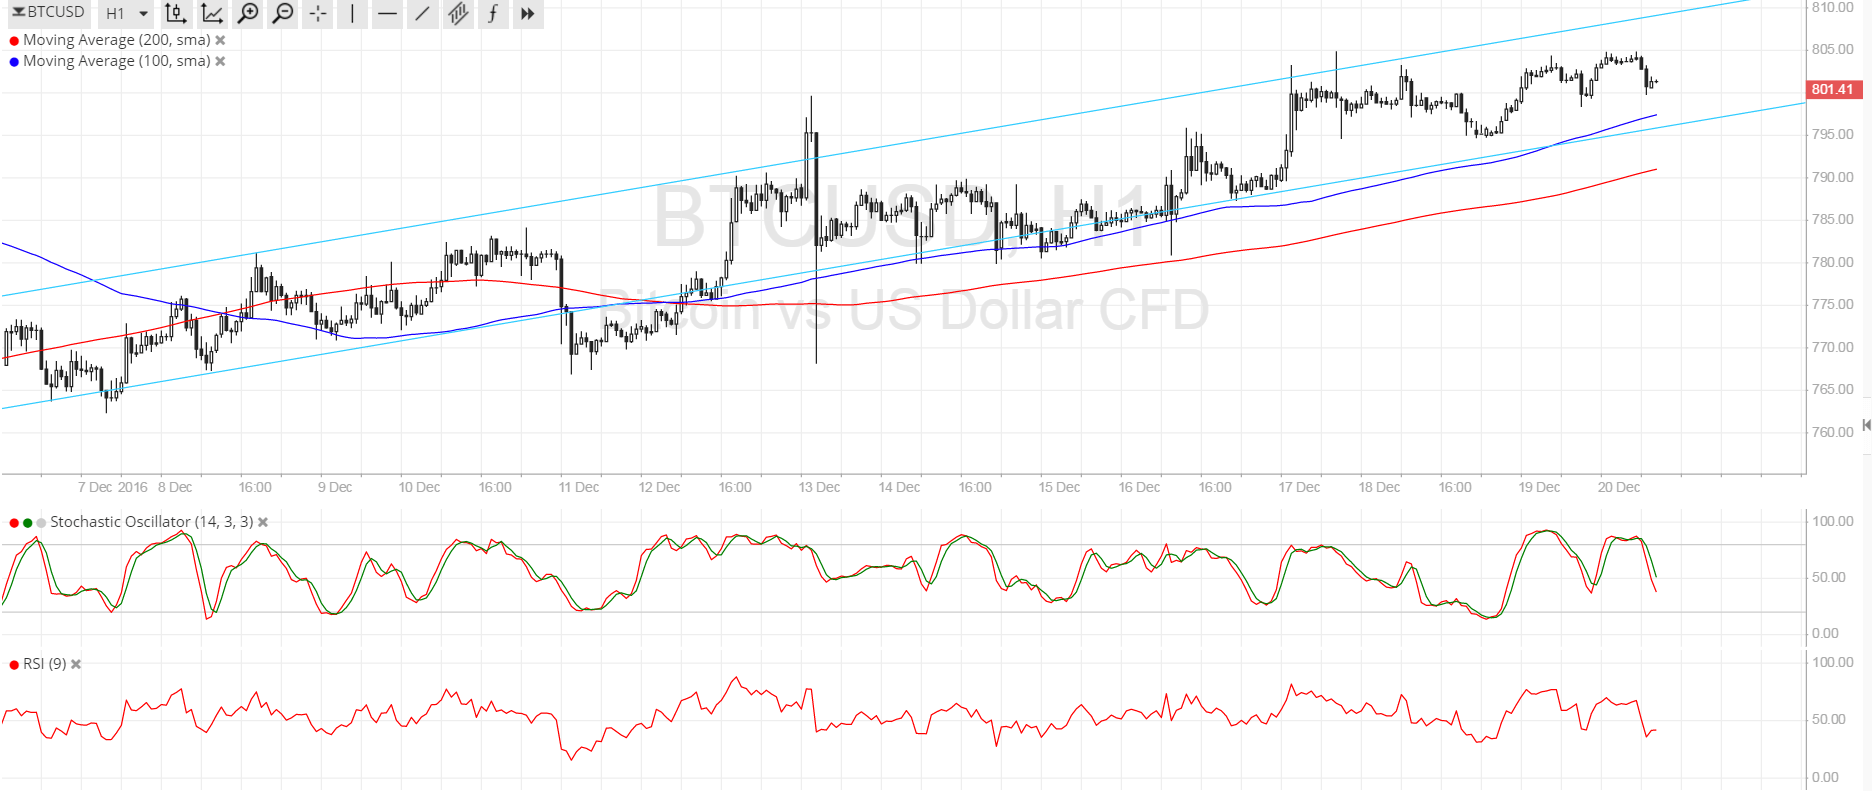
- Bitcoin price is still on its uptrend, moving inside what appears to be either a rising wedge or an ascending channel on its 1-hour chart.
- Price is in the middle of the formation but looks ready for a test of support.
- Technical indicators are suggesting that the climb could carry on.
Bitcoin price has been crawling slowly higher as bulls are looking exhausted but are refusing to let up.
Technical Indicators Signals
The 100 SMA is above the longer-term 200 SMA so the path of least resistance is to the upside. Also, the gap between the moving averages is getting wider, which means that bullish pressure is getting stronger. In other words, bitcoin price is more likely to bounce off the channel support above $795 rather than break lower.
Stochastic is heading south so a bit of profit-taking may be happening here. RSI is on middle ground, barely offering strong directional clues, but also appears to be turning lower to show that sellers are trying to gain control.
If the channel support holds, bitcoin price could make its way back up to the highs at $805 or onto the channel resistance at $810. On the other hand, an increase in bearish pressure could lead to a move towards the 200 SMA at $790, which might still keep losses in check.

Market Events
The main market events appear to have already passed for the week, although the BOJ decision could still spark some volatility. After all, dovish remarks and additional easing efforts from the Japanese central bank could revive stronger demand for US assets and boost the dollar against bitcoin price.
For now, investors still seem a bit worried about the IRS oversight on bitcoin transactions, which is possibly one of the reasons why the cryptocurrency has had trouble pushing for a sharper climb. In China, less talk of government regulation and yuan devaluation hasn’t given investors much reason to pile up their bitcoin holdings for the time being.
Charts from SimpleFX


