Bitcoin Price Key Highlights
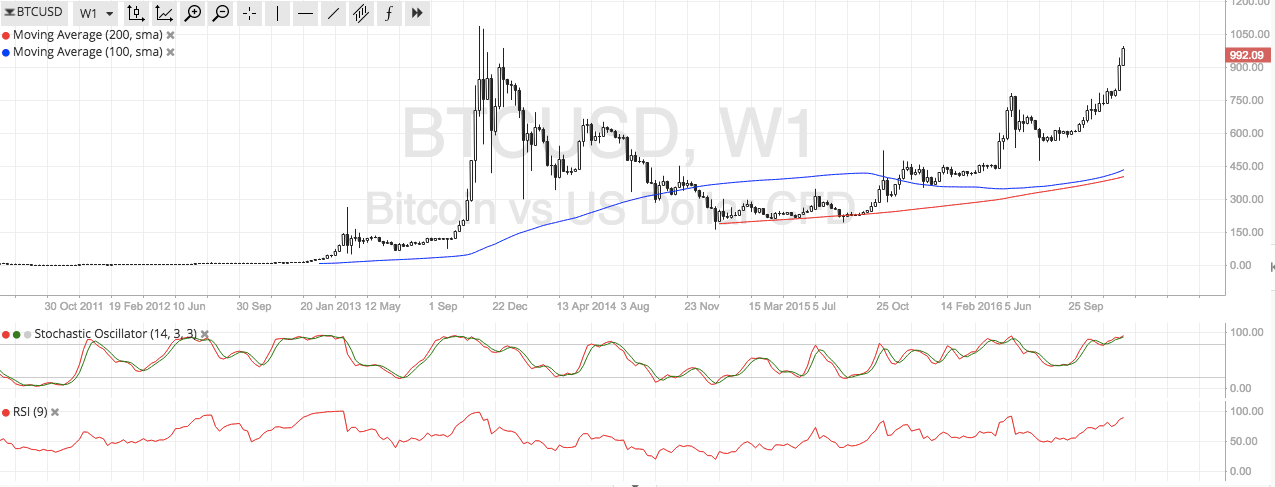
- Bitcoin price seems unstoppable in its climb, as strong bullish candles have formed on the weekly chart.
- The $1000 handle held as near-term resistance as predicted in the previous article since short-term traders likely booked some profits there.
- Still, the strength of the rally on the longer-term charts indicates that bulls have enough energy left in them.
Bitcoin price could be in for more gains past $1000 as long-term candles show no signs of reversal just yet.
Technical Indicators Signals
The 100 SMA remains above the 200 SMA on the weekly chart, confirming that further gains are likely. The moving averages are edging closer together, though, so there’s still a chance for a downward crossover which might draw some sellers in. If that happens, a brief pullback on short-term charts could be due.
Stochastic is indicating overbought conditions on this time frame, which means that buyers might want to take profits soon or allow sellers to take over. However, RSI is still heading north so bitcoin price could follow suit and aim higher.
On the weekly chart, it can be seen that bitcoin price found some resistance around the $1050 area so this might be the next take-profit point for those who have long positions or a selling point for bears who want to get in on a quick bounce off the ceiling. If this barrier is still breached, bitcoin could set its sights on the psychological $1100 and $1200 levels next.

Market Events
There hasn’t been much in the way of top-tier market events these days as bitcoin price seems to be driven by sheer momentum. The thin liquidity environment is also magnifying the moves as relatively smaller positions are capable of steering the cryptocurrency in a particular direction.
Apart from that, the general risk-off vibe left in the financial markets as traders tread carefully in light of geopolitical concerns and looming uncertainties for the coming year has been supportive of bitcoin price as well.
Charts from SimpleFX


