Reason to trust

How Our News is Made
Strict editorial policy that focuses on accuracy, relevance, and impartiality
Ad discliamer
Morbi pretium leo et nisl aliquam mollis. Quisque arcu lorem, ultricies quis pellentesque nec, ullamcorper eu odio.
Bitcoin price dropped yesterday from a high of $284 to a low of around $267. Since the start of the new bullish wave on the 1st of March, bitcoin price failed for the first time yesterday to continue printing higher highs. Technical analysis shall give us clues of whether or not the bullish wave will continue on today to push the price to higher levels after yesterday’s downtrend.
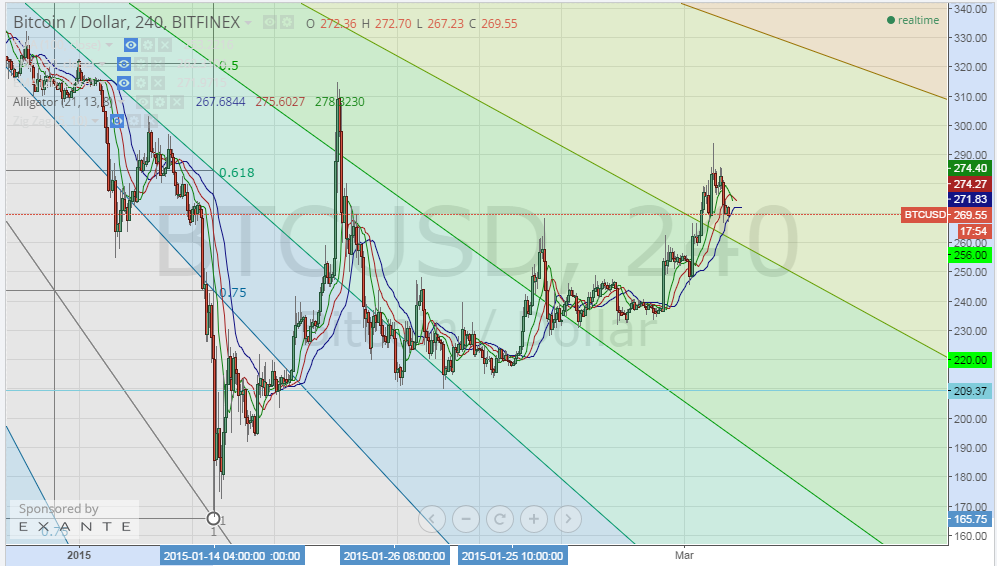
By studying the 4 hour Bitfinex (BTC/USD) chart from tradingview.com, plotting the William’s Alligator indicator and drawing a Fibonacci retracement fan across a trend line that extends between the high reached on the 13th of November 2014 ($477) and the low reached on the 14th of January 2015($166) (look at the below chart), we can conclude the following:
- Bitcoin price started declining after overshooting above the 62% Fibonacci retracement level at around $284.6, so even though the price rose up to around $294 on Tuesday, the market pulled the price down again below the 62% retracement level which also occurred on the 26th of January as shown on the below chart.
- The alignment of the SMAs of the Willam’s Alligator indicator shows that the bullish wave has slowed down as the green 8 period SMA (jaws) has just fell below the red 13 period SMA (teeth). However, we can see the jaws rise above the teeth within the next 8 hours, so the bulls can resume their run within the next 24 hours.
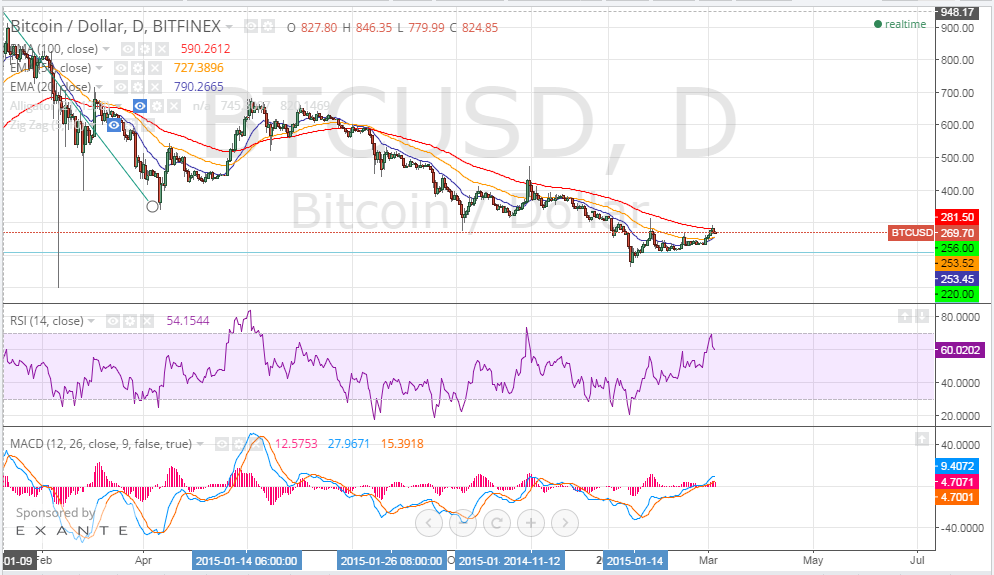
The 1 day Bitfinex (BTC/USD) chart can seem more optimistic for the bulls, so let’s take a look at what this chart can tell us:
- Bitcoin price is above the 20 and 50 day EMAs, yet it is still below the 100 day EMAs. If it rises above the 100 day EMAs, this can predict an even stronger bullish wave.
- The RSI is around 59 so there is still a 10 point window that can permit a rise in bitcoin price soon.
- The MACD is in the positive territory now and the blue MACD line is above the red signal line which is in favor of resumption of the bullish run.
Conclusion:
Bitcoin price stopped rising yesterday and a moderate downwards price correction wave was evident on yesterday’s charts. Our technical analysis predicts continuation of this month’s bullish run to push the price to higher levels, yet we can see the downwards price correction wave take the price down to touch the 38% Fibonacci retracement level fan at around $265 before the bulls take the upper hand again.
Charts from bitfinex


Dr. Tamer Sameeh,
I am just now beginning to get into the bitcoin world. I’ve been doing quite a bit of research on how it all works, but i have one underlying question: When is the best time to start investing? Should I wait and see where things go, or if the long term projection is positive, should I buy before it’s too late?
Thanks
Nobody knows for sure, and can’t answer that for you.
If you believe in the long term potential of Bitcoin, then buy at any price. Because if Bitcoin does in fact take off and reach mainstream adoption, it will be worth an order of magnitude more than it is today.
If you don’t believe in the long term potential of Bitcoin, then don’t buy at any price, unless you’re a trader accustomed to shorting.
As of now it’s hard for me to say, because I WANT to believe in the long term potential. I think I read too much and scare myself… I convince myself it’s good, then read one article about how it will end up being a flop, and I have second thoughts.
Thank you for the reply!