Bitcoin Price Key Highlights
- Bitcoin price made a sharp much-needed tumble after price hit record highs around the $1200 area.
- As predicted in an earlier article, that long-term resistance level is likely to inspire a lot of profit-taking that might unwind the cryptocurrency’s gains.
- Price is still trending higher on the daily chart, though, and bulls might be eager to hop in the climb at these bargain prices.
Bitcoin price suffered a sharp crash upon hitting a strong ceiling, inspiring a major pullback that could revive bullish interest.
Technical Indicators Signals
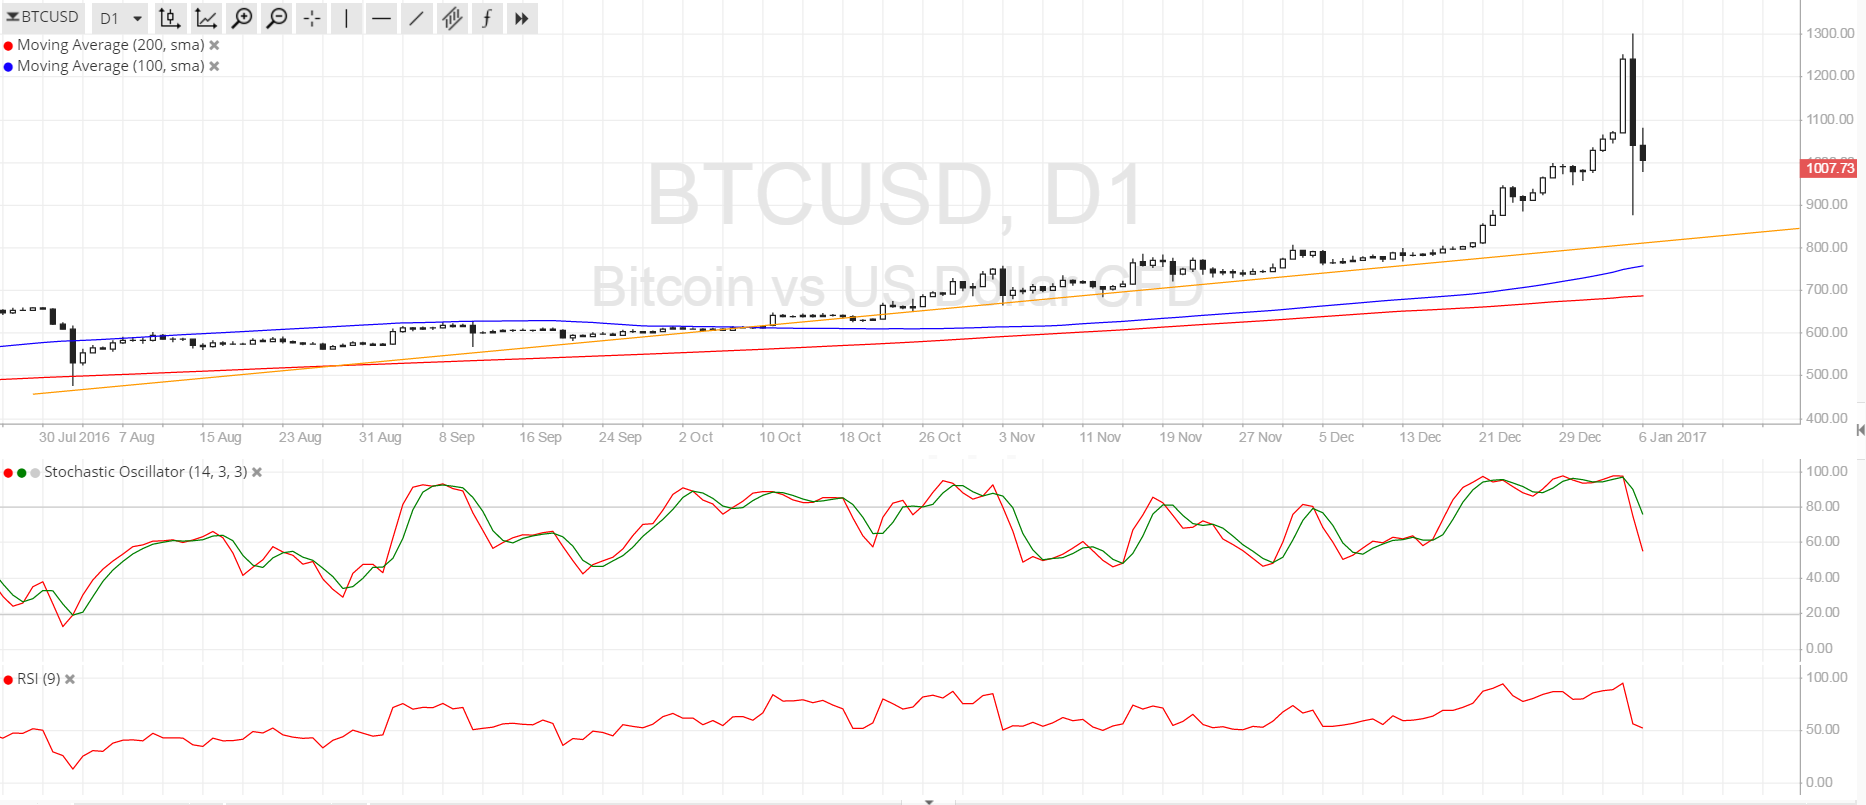
The 100 SMA is safely above the longer-term 200 SMA on the daily chart so the path of least resistance for bitcoin price is still to the upside. In addition, the gap between the moving averages has widened so bullish momentum could be strengthened at some point. A rising trend line can be drawn to connect the lows since mid-2016 and bitcoin price could find additional support at this area in the event of a much larger correction.
Stochastic is finally turning lower as buyers gave in to selling pressure and are allowing bears to take the wheel for the time being. RSI is also heading south so bitcoin price could follow suit for some time, allowing bulls to take a much-needed break from the almost unstoppable climb.

Market Events
US economic data was actually below expectations yesterday and this inspired a fresh wave of dollar losses, that ultimately took bitcoin price to new highs. However, this quick bump higher also triggered limit orders for long positions so the massive profit-taking activity was enough to push bitcoin price back to the $900-950 region.
Even so, demand for the cryptocurrency remains strongly supported as Chinese investors could grab the opportunity to hop in the uptrend at much cheaper levels than before. After all, the government has expressed its intention to impose additional curbs on foreign investment so mainland traders are looking for alternative ways to pursue higher returns and hedge their yuan-denominated assets.
Charts from SimpleFX