Bitcoin Price Key Highlights
- Bitcoin price is moving higher but is currently in a consolidation pattern.
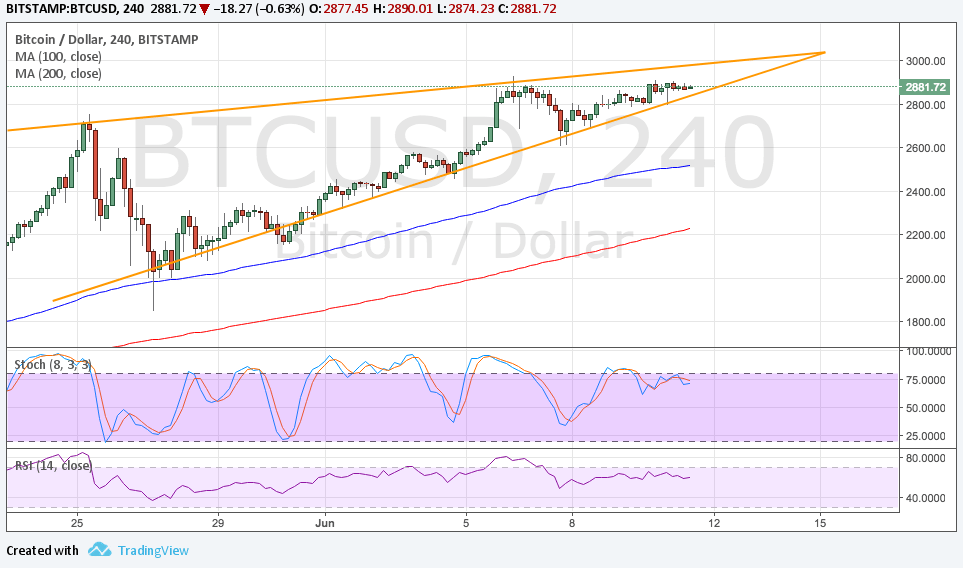
- Price has formed higher lows and higher highs, creating a rising wedge formation visible on its 4-hour time frame.
- Bitcoin is testing support at the moment and could be due for a move back to the resistance around the recent highs or the $3000 level.
Bitcoin price is consolidating in a rising wedge pattern but bullish pressure seems to be very much in play.
Technical Indicators Signals
The 100 SMA is above the longer-term 200 SMA so the path of least resistance is to the upside. In other words, a bounce off support around the $2800-2900 levels could be more likely than a break lower. The gap between the moving averages has been pretty steady, indicating the presence of sustained bullish momentum.
However, stochastic is already turning lower from the overbought zone to suggest a return in selling pressure. RSI is also heading south after a brief stay in the overbought region, also indicating a potential return by bears. If so, bitcoin price could retreat to the area of interest around the $2600 mark, which is also near the 100 SMA dynamic support.

Market Factors
The dollar is putting up a bit of a fight against its peers in the past few days as the event risk from Comey’s testimony appears to have passed. Recall that traders are worried that this particular investigation could yield evidence that Trump committed an impeachable offense, which either has something to do with sharing intelligence information to Russian officials or impeding the investigation on former national security adviser Flynn.
However, Comey’s statement didn’t reinforce either of the speculations so traders are regaining confidence that the Trump administration could move past this setback and continue the progress in implementing fiscal policy changes, particularly tax reform.
From the bitcoin industry side of things, there have been no major updates so far but the latest ones have been positive for the cryptocurrency and supportive of more gains. Of course any negative reports could lead to dips in bitcoin price, especially since it is moving close to record highs and the chance for profit-taking is strong.