Bitcoin Price Key Highlights
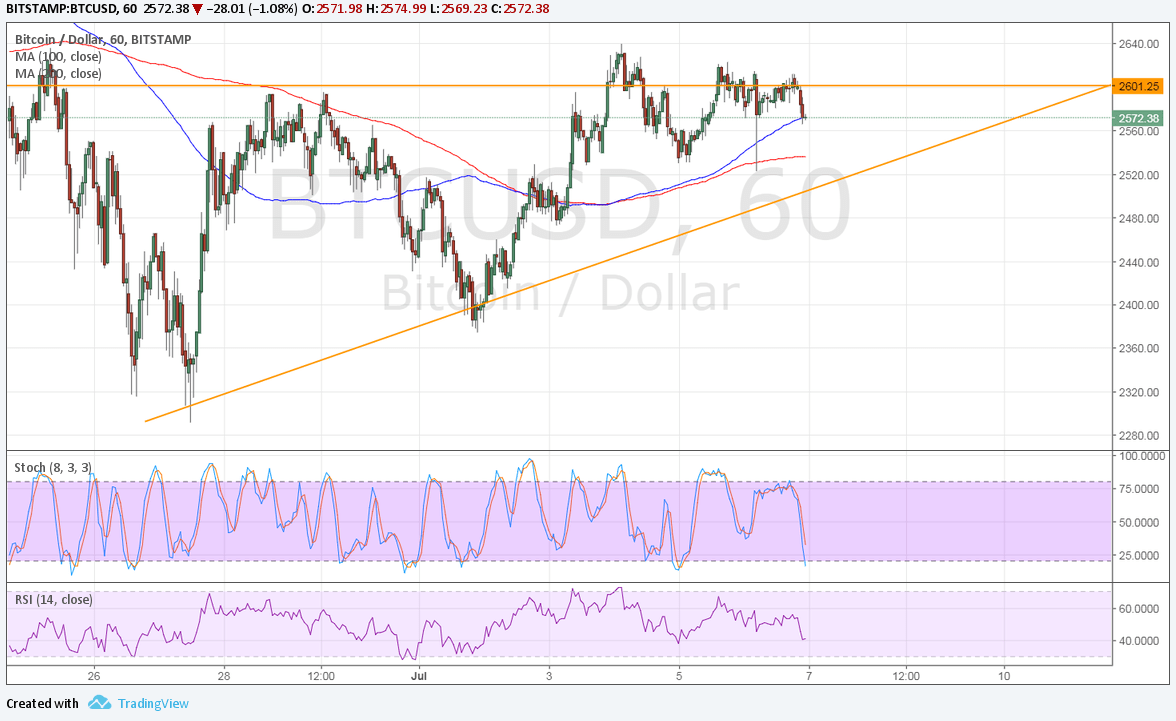
- Bitcoin price has formed higher lows and hit resistance at $2600, creating an ascending triangle pattern on its short-term charts.
- Price is still hovering around the resistance and could be due for a move back to support if it holds as a ceiling.
- Technical indicators are giving mixed signals at the moment.
Bitcoin price is testing the ascending triangle resistance, still deciding whether to make a bounce or an upside breakout.
Technical Indicators Signals
The 100 SMA is above the longer-term 200 SMA so the path of least resistance is to the upside. The gap between the moving averages is getting wider to reflect strengthening bullish momentum, which might be enough to take bitcoin price past the resistance and onto a stronger climb. Also, the 100 SMA is holding as dynamic support at the moment.
A break above the triangle resistance could send bitcoin price around $280 higher or the same height as the triangle formation. However, stochastic is heading south to show that sellers are on top of their game at the moment. RSI is also moving down so bitcoin might be due for another test of support around $2500.

Market Factors
The dollar took a hit against its peers in recent trading sessions as leading jobs indicators turned out weaker than expected. The ADP non-farm employment change reading, although considered a poor preview of the NFP, showed a smaller than expected gain and a downgrade in the previous report.
Also, the ISM non-manufacturing PMI signaled a drop in its jobs component, likely erasing the gains from the manufacturing part of the survey. The services sector accounts for a larger part of the economy, though, so this non-manufacturing component could carry more weight.
Analysts are expecting to see a 175K increase in hiring, larger than the previous 138K rise. Another miss in the NFP report could significantly dampen rate hike expectations for September or December, which might mean big losses for the dollar against bitcoin price. On the other hand, a very strong read could renew tightening expectations and lead to a dollar rally across the board.