Bitcoin Price Key Highlights
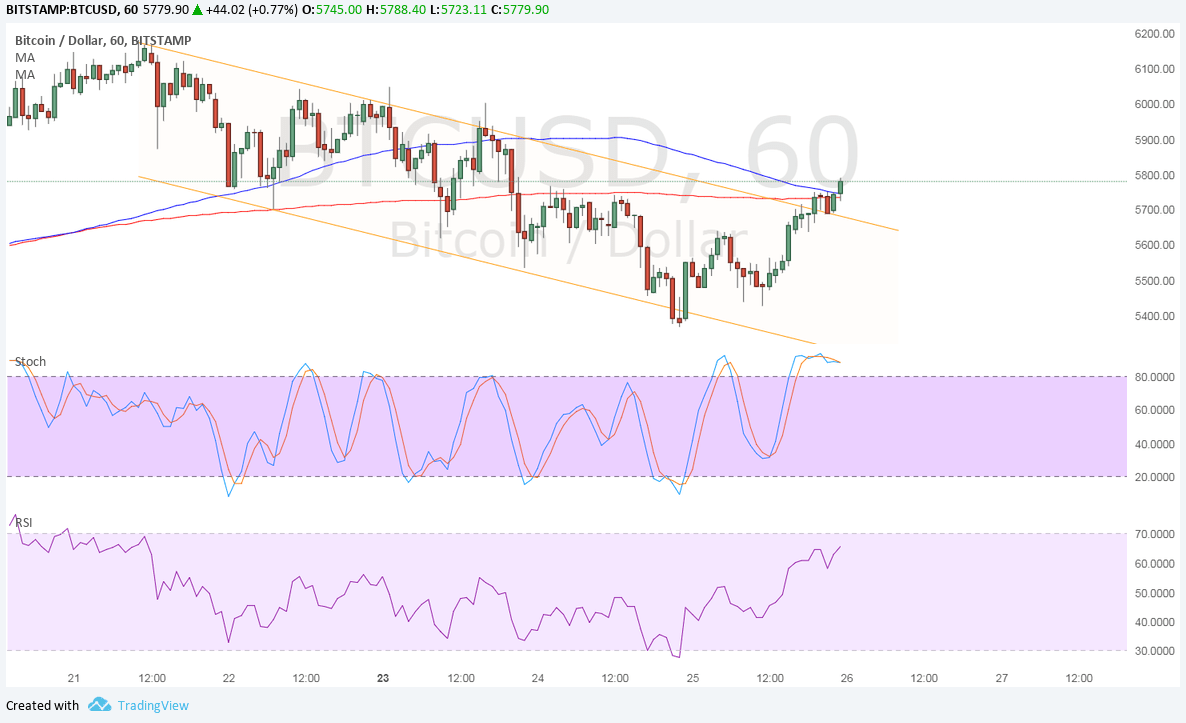
- Bitcoin price was previously trading lower inside a descending channel on the 1-hour time frame.
- Price has broken past the channel resistance to indicate that bulls are putting up a fight and that the longer-term area of interest could keep losses in check.
- In that case, bitcoin price still has a shot at testing the all-time highs and maybe even creating new ones.
Bitcoin price is breaking out of its short-term downtrend to indicate a return in bullish momentum and potential to retest the latest highs.
Technical Indicators Signals
The 100 SMA is still slightly above the longer-term 200 SMA to indicate that the path of least resistance is to the upside. Although the gap has narrowed to indicate a potential downside crossover and the moving averages are holding as dynamic inflection points for now, bullish pressure could still return and prevent the crossover from being completed.
However, stochastic is already indicating overbought conditions to show that bulls might need to take a break. RSI has a bit more room to climb so buyers could stay on top of their game for a bit longer. But when both oscillators turn down from the overbought region, selling pressure could return and trigger a retest of the broken channel resistance or even a move back inside.

Market Factors
US dollar demand is slowing on more roadblocks to tax reform and uncertainties over the next Fed Chairman. Delays in pushing the fiscal agenda by the Trump administration, along with a dovish Fed head pick, could lead to a double whammy for the currency which bitcoin price could take advantage.
Even though the emergence of bitcoin gold is piling on a fresh set of risks for the upcoming network upgrade, bitcoin core remains well-supported by majority of the network and could see a similar scenario to the August upgrade. At that time, rival version bitcoin cash was unable to gain much support from the miners to overtake the original version.