Bitcoin Price Key Highlights
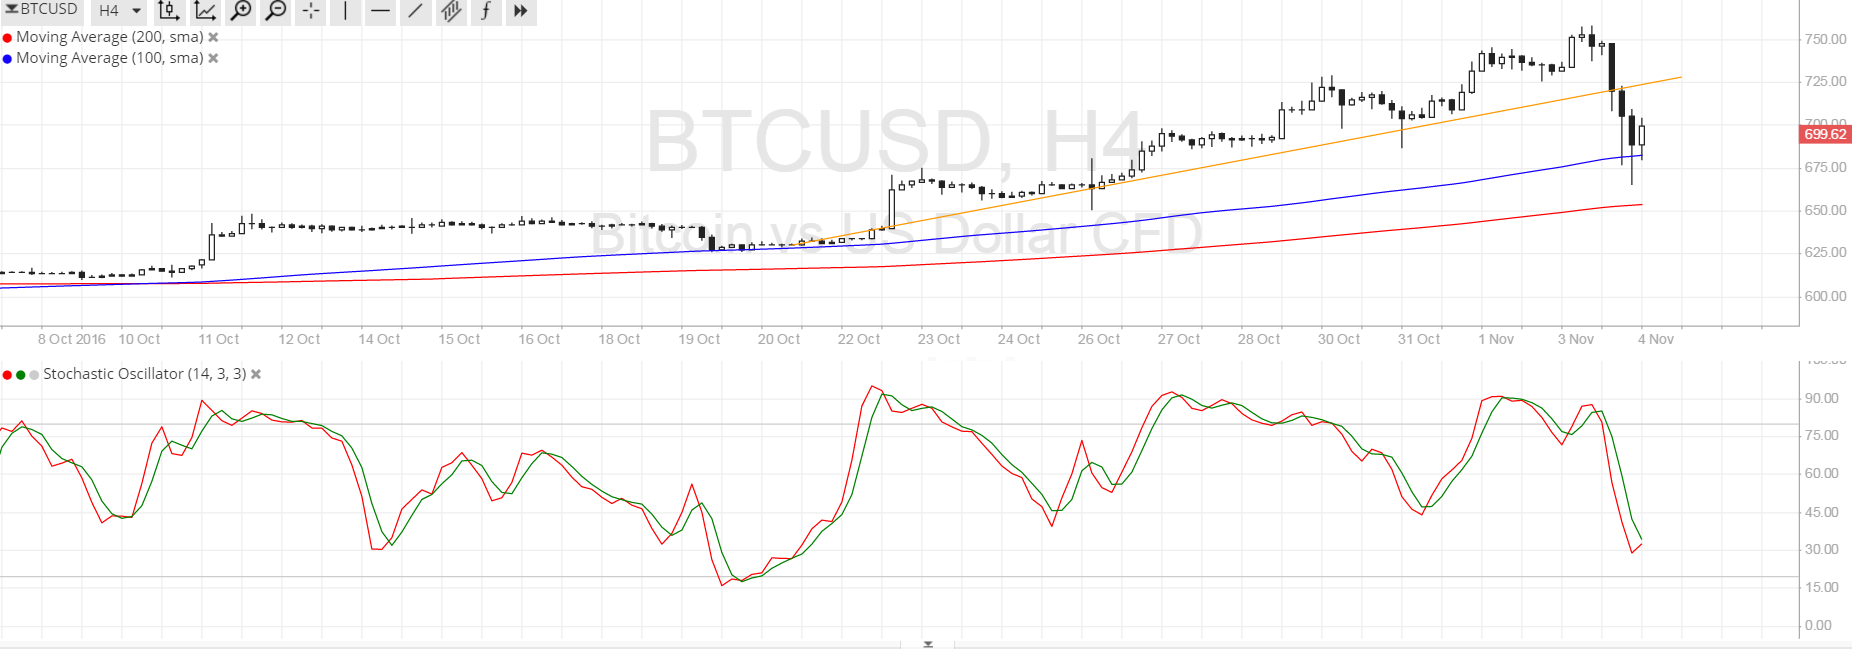
- Bitcoin price broke below the short-term uptrend line shown in a previous article as buying pressure seemed exhausted.
- Price is currently testing a near-term inflection point, which might still be able to hold as a floor.
- If bears put up a fight, a pullback to the broken trend line could be enough to bring more selling pressure.
Bitcoin price made a sharp break below a short-term rising trend line as buyers could no longer keep up the climb.
Technical Indicators Signals
The 100 SMA is still above the 200 SMA so the path of least resistance could be to the upside. In fact, the 100 SMA is holding as dynamic support for now, with some buyers likely waiting with their long orders at that level. The gap between the moving averages is still pretty wide and growing so bullish momentum could still pick up.
A larger drop could find support at the 200 SMA dynamic support around $650 next, with a break below this level likely setting the stage for more losses in bitcoin price. Stochastic is on its way down but appears to be turning higher, possibly yielding a quick correction to the broken trend line around $720.

Market Events
Reports that the Chinese government will impose capital controls on bitcoin trading weighed heavily on the cryptocurrency’s performance, as this would severely dampen the influx of funds coming in from Chinese investors. Keep in mind that strong investor interest from the Chinese has been mostly responsible for the recent climb in bitcoin price as they seek to hedge against yuan devaluation.
However, Chinese authorities may be onto them, as sources report that the government is looking into ways to curb bitcoin trading in the domestic market. In particular, local exchanges may need to comply with limitations on amounts being moved outside the Chinese economy and cap the number of bitcoins being sent abroad.
Then again, these restrictions might not be implemented well enough to hurt bitcoin price due to the nature of its network and trading. Still, it’s worth keeping tabs on how these developments play out since it would affect the main market of bitcoin moving forward.
Charts from SimpleFX