Reason to trust

How Our News is Made
Strict editorial policy that focuses on accuracy, relevance, and impartiality
Ad discliamer
Morbi pretium leo et nisl aliquam mollis. Quisque arcu lorem, ultricies quis pellentesque nec, ullamcorper eu odio.
Bitcoin Price Key Highlights
- Bitcoin price has recently made an upside breakout from consolidation and a rally above an area of interest, but it looks like buyers are losing steam.
- A pullback to the area of interest might be necessary before the rally regains ground.
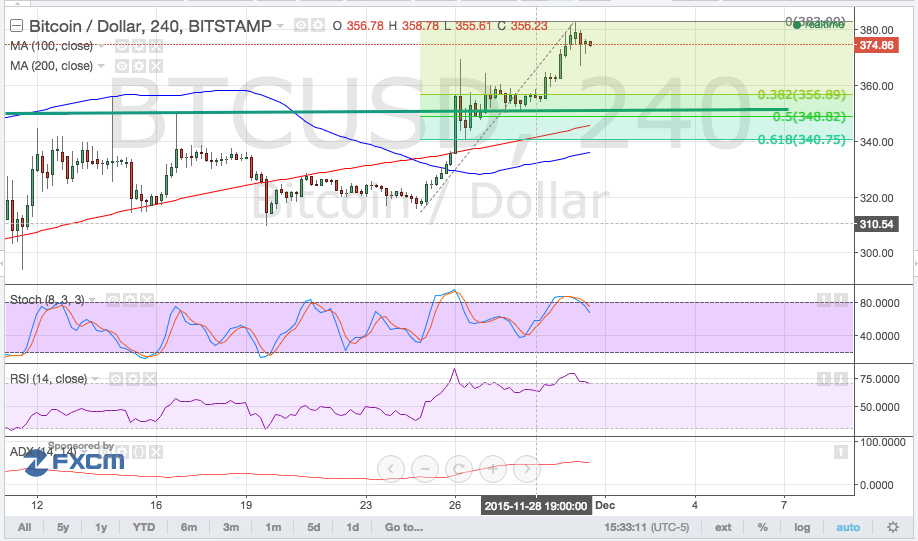
Bitcoin price could make a correction to the Fibonacci retracement levels marked on the 4-hour time frame before resuming its climb.
Resistance Turned Support
The Fib levels based on the latest swing low and high show that the 50% level lines up with the broken resistance at $350. This could hold as support from now on since it’s also near the 200 SMA dynamic inflection point. A larger correction could last until the 61.8% Fib near the 100 SMA.
Speaking of moving averages, the 100 SMA is still below the 200 SMA so the path of least resistance might be to the downside. If so, a break below the lowest Fibonacci retracement level around $340 could be enough confirm that further losses are likely.
In that case, bitcoin price could retreat to the next visible support area at $300-310. A break below this level could signal that a longer-term selloff is underway.

Meanwhile, stochastic is indicating overbought conditions with a slight bearish divergence. This means that the current rally is set to stall from here, supporting the case for a correction play.
Similarly, RSI is pointing down from the overbought region, indicating that sellers might take control of price action. If this simply spurs profit-taking activity, reversal candlesticks could form around the 50-61.8% Fibonacci retracement levels to signal a bounce to the previous highs at $380 and beyond.
Meanwhile, the average directional index is treading higher and making its way past the 50.0 level to confirm that trending market conditions are in force. This could mean that the current uptrend could carry on, potentially bringing bitcoin price back to its highs near $500 this year.
Charts from Bitstamp, courtesy of TradingView


