Bitcoin price continued to move along the $285 level which has become a critical support level after March’s brand new bullish wave. Throughout today’s trading sessions, bitcoin has been trading near $285 and a bigger trading volume is indispensable before we can see the bulls take control of the market again.
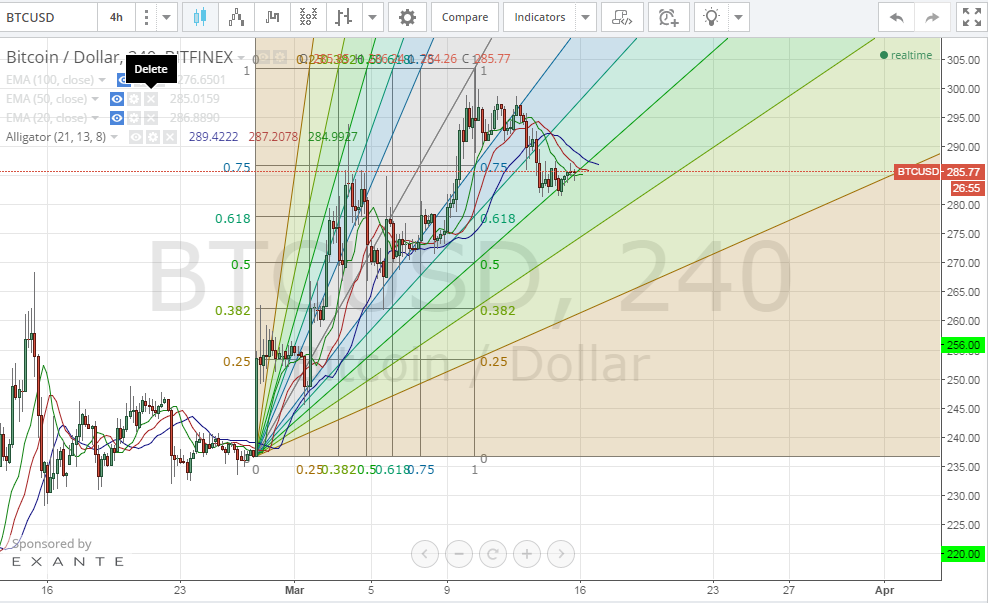
Let’s talk a look at the Bitfinex 4 hour (BTC/USD) chart from tradingview.com and plot the William’s Alligator indicator accordingly (look at the below chart). We can conclude the following:
- As per the new bullish wave, we can plot a Fibonacci retracement fan across a trend line that extends between the low scored on the 27th of February ($236.68) and the high printed on the 10th of March ($303.62).
- Since the start of the bullish wave, bitcoin price exhibited a rising support level that coincided with the 61.8% Fibonacci retracement fan level until this support level was breached on the 13th of March.
- Right now, the price is testing the 50% Fibonacci retracement fan level and it seems that bitcoin price will bounce back off this level, so the downtrend that started on the 12th of March will be nothing more than the market’s attempt to correct price following a 10 day bullish rally.
- The SMAs of the William’s Alligator indicator still don’t show a bullish alignment. A bullish alignment (blue downwards, red in the middle and green on top) can be used as a sign that signals start of a bullish wave.
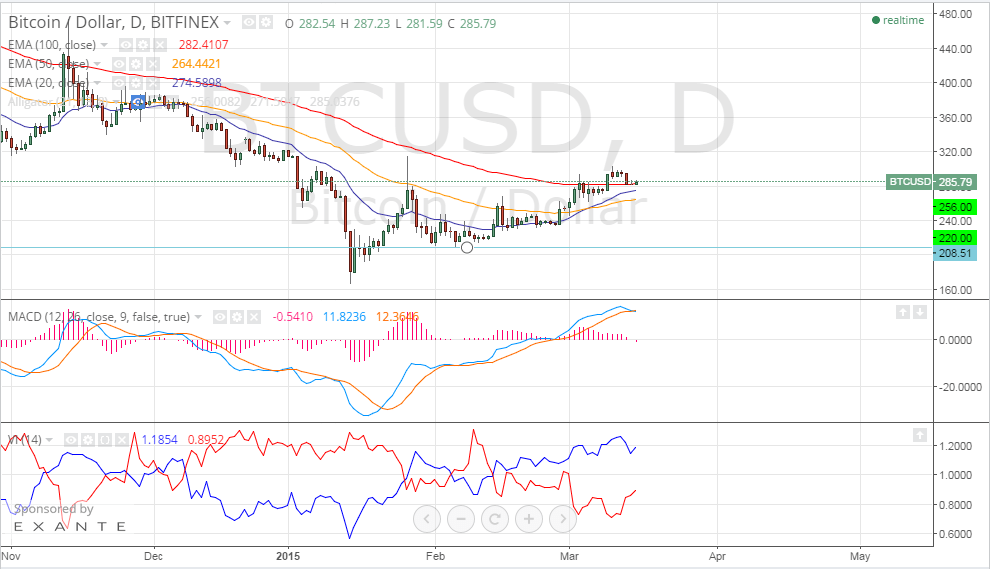
By studying the 1 day Bitfinex (BTC/USD) charts from tradingview.com, plotting the 20, 50 and 100 period EMAs and executing the MACD and Vortex Indicators (look at the below chart), we can notice the following:
- Bitcoin price is still above the 20, 50 and 100 EMAs which reflects the current bullish trend of the market.
- The MACD indicator is in the positive territory, yet we need to see the blue MACD line cross above the red signal line to see the bulls take control again.
- The Vortex Indicator reflects the new bullish wave that has been controlling the market since the beginning of March.
Conclusion:
Bitcoin price is now moving sideways to the $285 critical support level. Our technical analysis denotes that price will bounce off this level soon and will resume rising towards $300.
Charts from Bitfinex


Very much appreciated.
Thank you Dr, as always, much appreciated. (just note; careful using those relative terms, like “soon” and “jump” 😀 they get ME all the time!)