Bitcoin Price Key Highlights
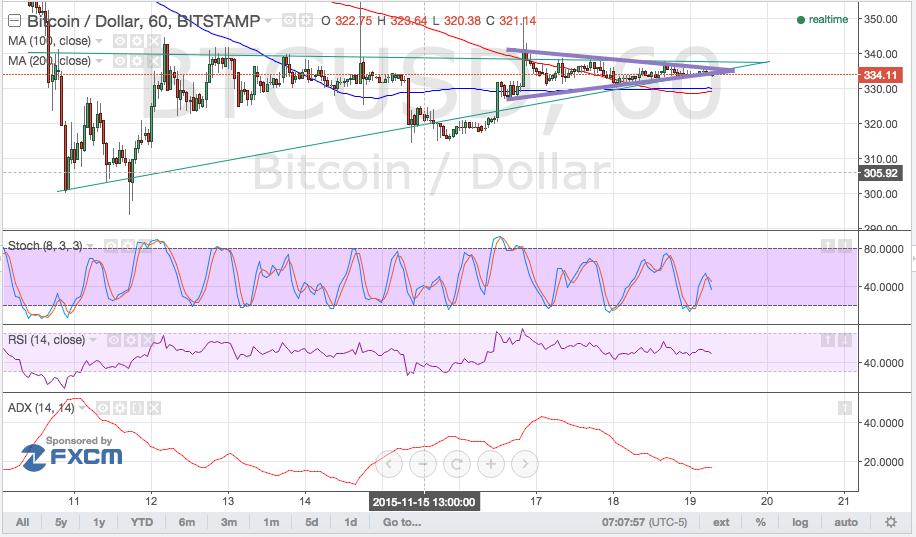
- Bitcoin price is going all out in terms of consolidation, as a smaller pennant pattern formed right inside the larger triangle visible on its 1-hour time frame.
- Interestingly enough, the larger consolidation pattern suggests a continuation of the longer-term selloff while the smaller consolidation pattern hints at a potential upside breakout since it’s coming from a quick bounce.
Bitcoin price still seems to be undecided on its next direction, as it has returned to its pre-rally levels and is waiting for more catalysts.
Bears Still in the Game?
Oscillators seem to be showing that bearish pressure is still in play, with stochastic pointing south and RSI also on its way down. However, both indicators are stuck on middle ground, which means that bitcoin price could still go either way.
Meanwhile, the 100 SMA is starting to make an upward crossover from the 200 SMA to indicate that the path of least resistance is to the upside. It’s still too early to tell if this is a decisive crossover if the moving averages are just oscillating, hinting at further consolidation down the line.

The average directional index is also below the 20.0 level, confirming that bitcoin price could keep cruising sideways from there. The freshly released FOMC meeting minutes did very little to push the dollar in a particular direction, even though policymakers affirmed that they’re on track to hiking interest rates in December.
With that, bitcoin price could hold out for much stronger market catalysts, possibly sitting tight until an actual Fed rate hike is announced. There seem to be no major events or news reports coming out of the bitcoin industry which could directly affect the cryptocurrency as well.
Intraday support level – $330
Intraday resistance level – $340
Technical Indicators Settings:
- 100 SMA and 200 SMA
- Stochastic (8, 3, 3)
- RSI (14)
- ADX (14, 3)
Charts from Bitstamp, courtesy of TradingView


