Bitcoin Price Key Highlights
- As predicted in an earlier article, bitcoin price was prime for a pullback to the broken resistance area visible on its 1-hour and 4-hour time frames.
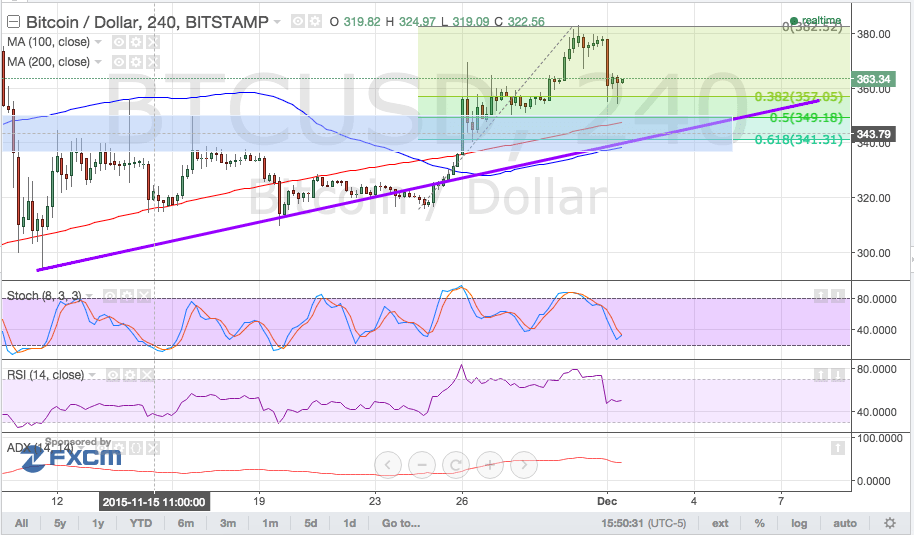
- Now that bitcoin price is in the middle of its corrective wave, applying the Fib tool to the latest swing low and high reveals that the 50% level lines up with the area of interest.
Bitcoin could be ready to resume its climb pretty soon, as the confluence of Fib levels and inflection points could hold as support for price action.
Rising Trend Line
Although bitcoin price appears to be finding support at the current levels, a larger correction might still be possible. The 50% Fib is closer to the broken resistance area and is also near the long-term 200 SMA.
A rising trend line can be drawn to connect the latest lows of price action, with this ascending support level coinciding with the 61.8% Fibonacci retracement level around $340.
This also lines up with the dynamic support at the 100 SMA. However, this short-term moving average is still below the 200 SMA so the path of least resistance might be to the downside. A break below the 61.8% Fib or rising trend line support might be enough to confirm that the longer-term selloff is still in play.

Stochastic is still on the move down, which means that sellers are still on top of their game and might be able to push for a deeper pullback. At the same time, RSI is heading south so bitcoin price might be able to fall further.
The average directional index is reflecting trending market conditions, so the ongoing uptrend could have a chance at gaining traction. However, if this ADX falls back below the 50.0 level, a return to ranging market conditions might be in order.
Charts from Bitstamp, courtesy of TradingView


#MMMExtra #Work_at_Home #Job #MyJob