Reason to trust

How Our News is Made
Strict editorial policy that focuses on accuracy, relevance, and impartiality
Ad discliamer
Morbi pretium leo et nisl aliquam mollis. Quisque arcu lorem, ultricies quis pellentesque nec, ullamcorper eu odio.
Bitcoin Price Key Highlights
- Bitcoin price has been moving sideways for quite some time, waiting for market catalysts to provide a clear direction.
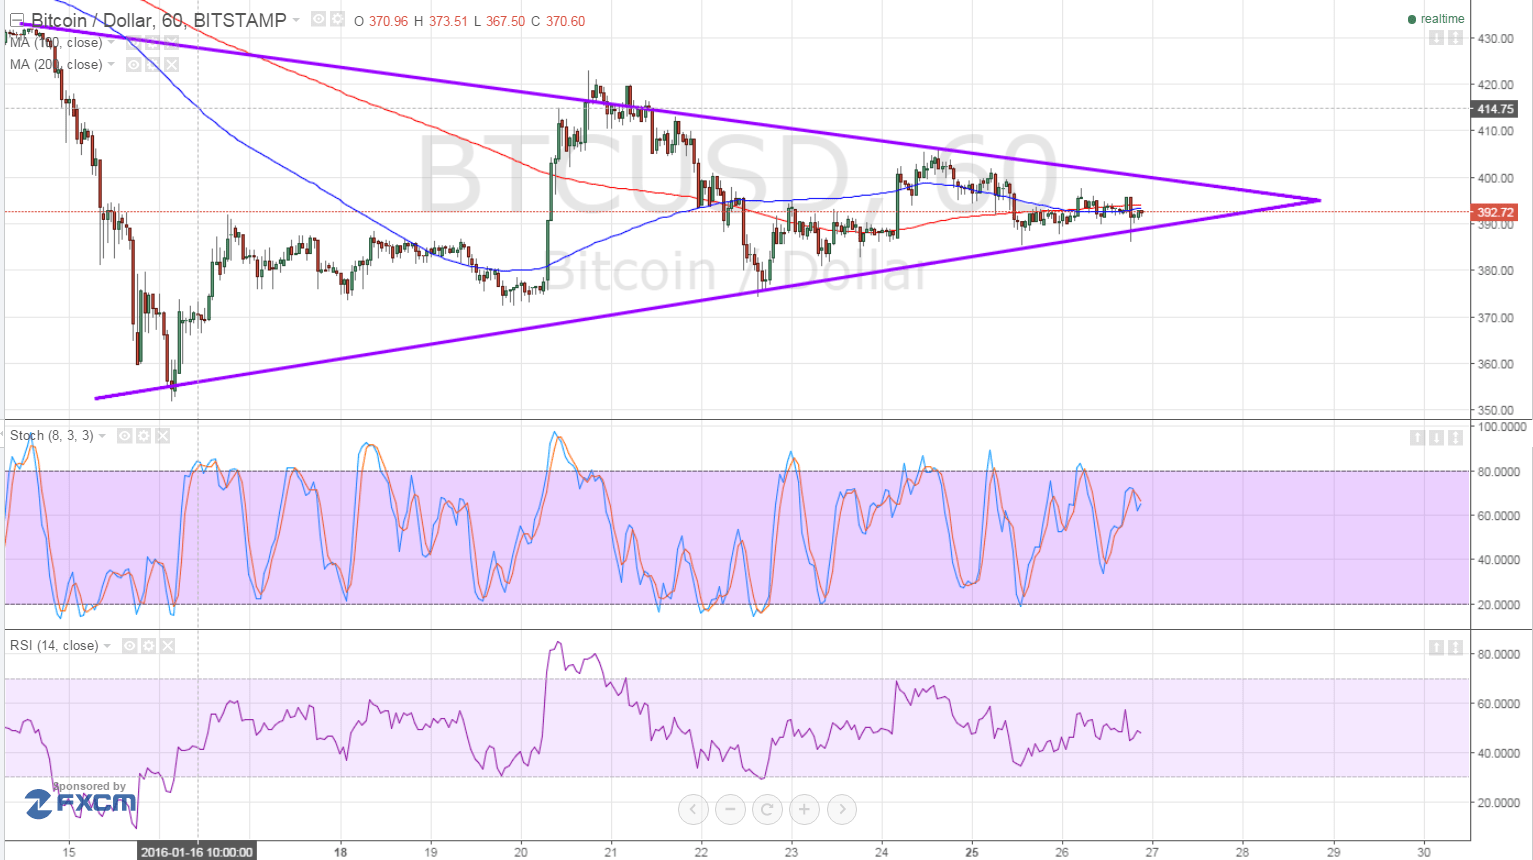
- Price has formed higher lows and lower highs, creating a symmetrical triangle visible on the 1-hour time frame.
- Technical indicators are also reflecting hesitation among buyers and sellers.
Bitcoin price has been unable to pick a clear direction lately, with market participants holding out ahead of the top-tier market events this week.
Technical Indicators Signals
The moving averages are oscillating, confirming that this consolidation pattern could carry on for a while. Bitcoin price is treading around the bottom of the triangle formation but is also nearing the peak of the pattern, hinting that a breakout should take place soon.
Stochastic is pointing down, suggesting that bearish pressure could trigger a downside break of the triangle support and near-term consolidation around $380. In that case, bitcoin price could fall until the next area of interest at $300.
RSI is on middle ground, barely providing any strong clues at the moment. Bitcoin price might still have a chance to test the top of the triangle near the $400 resistance level before breaking out. If bullish pressure is strong enough, an upside break can take place and bring price up to the next resistance at $465 then closer to $500.

Market Catalysts
Perhaps the biggest market catalyst this week might be the FOMC statement, although no actual monetary policy changes are expected for now. After all, the Fed just hiked interest rates by 0.25% in December and might be keen on preventing additional market volatility for now.
Instead, market watchers will be on the lookout for potential clues on when the next rate hike might take place. Based on US data, this might be a possibility for March, but the current market situation and commodity price slump might lead officials to push this timeline back.
Indications of a potential rate hike in March could still revive dollar demand, leading to a downside break for bitcoin price. On the other hand, insisting that they would proceed at a gradual pace when it comes to tightening could mean losses for the dollar and a pickup in risk-taking, which is positive for bitcoin price.
Risk Sentiment Changes
Speaking of risk sentiment, this has been the major factor in pushing financial market action these days, with risk-on flows positive for bitcoin price and risk-off flows keeping its gains in check.
Sentiment has been shifting on a dime lately, as Asian equities have once again ended lower but the pickup in oil prices has allowed Western markets to recover. This tug-o-war is reflected in the tight consolidation of bitcoin price for the time being, with a strong push in either direction likely to determine the longer-term trends of the cryptocurrency.
Intraday support level – $380
Intraday resistance level – $400
Technical Indicators Settings:
- 100 SMA and 200 SMA
- RSI (14)
- Stochastic (8, 3, 3)
Charts from Bitstamp, courtesy of TradingView


