

Bitcoin Price Key highlights
- Bitcoin price has been on a tear against the US dollar these days, as the virtual currency is taking advantage of the Greenback’s weakness stemming from bleak economic data.
- Price has formed a bullish triangle pattern after the recent rally, indicating that traders are pausing and waiting for more confirmation of upside momentum.
Bitcoin price could be due for an upside break from the short-term consolidation pattern visible on its 1-hour chart against the dollar, as central bank uncertainty is keeping the dollar’s gains in check.
Uptrend to carry on
An upside break from the triangle or pennant pattern could indicate that bulls are charging once more, potentially taking bitcoin price to the $280 levels.
Stochastic is already indicating overbought conditions while RSI is turning lower, suggesting that the uptrend may have already been exhausted and that a pullback is in order. If so, bitcoin price could retreat to the moving averages support near $260. This also lines up with an area of interest visible on this short-term chart.
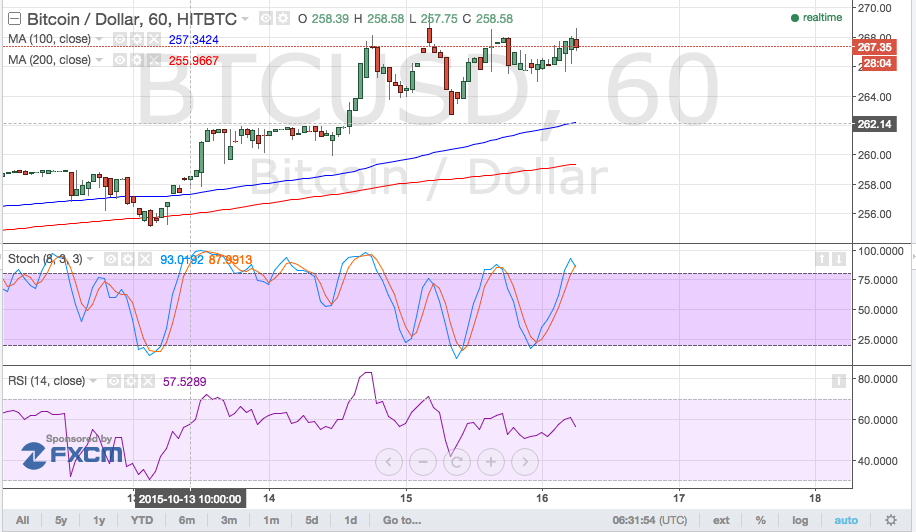

The 100 SMA is safely above the 200 SMA, suggesting that the path of least resistance is to the upside and that the rally is bound to resume sooner or later. A pullback would offer a better opportunity to catch the uptrend at a lower price while an upside breakout would indicate significant bullish momentum.
Intraday support level – $265
Intraday resistance level – $270
Charts from TradingView