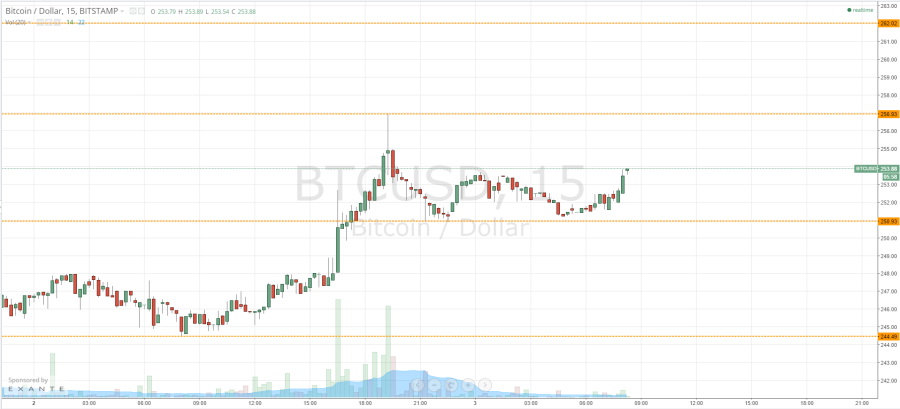
Late yesterday afternoon (GMT) shortly before the European session closed for business, we published a piece outlining the day’s action in the bitcoin price and offering up our suggestions as to what we would be watching throughout the US afternoon. We highlighted a couple of key levels that – if reached – would present us with an intraday bias, and also slated the possibility of a range strategy providing we remained within what we had down as in term support and resistance. Overnight, action has matured, and were now trading out of the range within which we held during Thursday’s session, and there are a number of fresh key levels we are watching. Here’s what to look at. A quick look at the chart.
As you can see, in term support now lies at 250.93, and in term resistance at 256.93. Short-term, these are the two levels that we will be keeping an eye on. We are currently trading around the midway mark between the two, and we will look to break of either to form an intraday bias. If we can get some bullish momentum behind the bitcoin price, a break above 256.93 would signal a long entry towards 262.0 as an initial upside target. A stop loss just below 256.93 (i.e. somewhere around 255.5) would ensure a timely exit in the event of a bias reversal.
Looking the other way, if we can break below 250.93, we would look to 244.49 initially, and 242 beyond that, as a medium-term downside target. In such a trade, a stop loss around 252 flat would present us with a positive risk to reward ratio, and keep losses to a minimum if we enter ahead of a turnaround.
Charts courtesy of Trading View


Nope no bull run ahead. Look at the btc-e charts to see it will grind side ways for a few days.