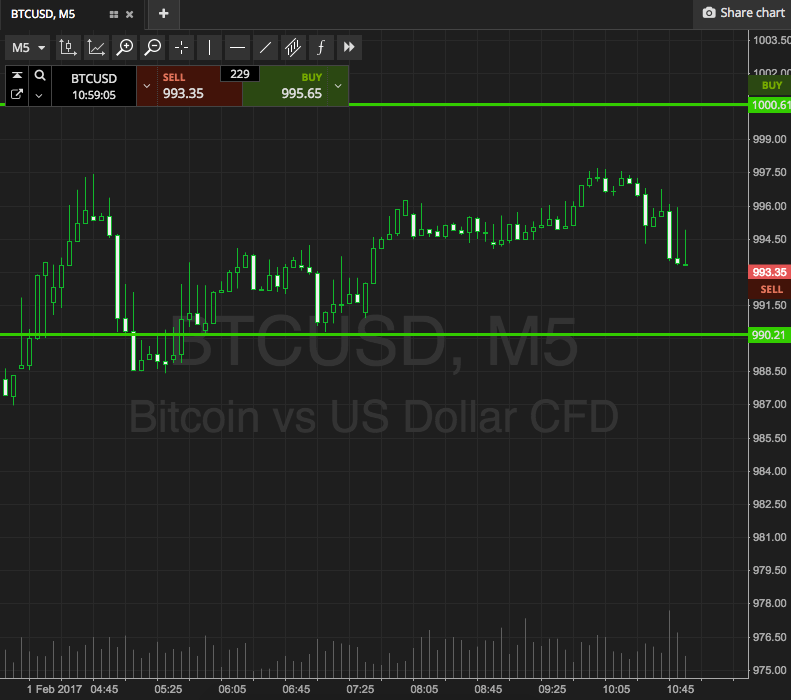
In yesterday evening’s analysis, we noted that – as a result of the action we have seen over the last few days in the bitcoin price – the 1000 level might come into play it soon. We opined that it may take a week or so, but in an optimistic forecast, we also noted that if we saw a break to the upside, it could come into play much sooner than that. As things turned out, this latter suggestion has proven valid. Overnight action saw the bitcoin price run through our predefined resistance level, giving us an opportunity to get in long towards our breakout strategy target, and also bringing the above-mentioned 1000 level into play for today’s session. We haven’t quite broken it yet, but we’re going to use it as resistance going forward into the European morning, and with any luck, we will get a break later today.
So, with this in mind, and as we move forward into today’s European morning session, here is a look at what we’re going for, and where we will look to get in and out of the markets according to our intraday strategy. As ever, take a quick look at the chart below to get an idea of what we’re focusing on before we get started. The chart is an intraday five-minute chart with around six hours’ worth of action displayed, and our range overlaid in green.

As the chart shows, the range in focus is defined by support to the downside at 990, and resistance to the upside at 1000. Obviously, we are hoping that the latter of these two levels comes into play before the former, but we are ready for both.
If price breaks above resistance, we will get in long towards an upside target of 1010. Conversely, a close below support will put us short towards 980.
Simple trades today. Let’s see how things play out
Charts courtesy of SimpleFX


