So that’s the big one broken. We’ve been looking for a 1300 test for the past few weeks (although we’ve also been slightly quiet about our intentions to trade it as and when it gets hit so as not to jinx the play), and we thought we might have to wait until volume picked up again early next week before it came.
As things have turned out, that’s not the case.
Price broke clean through 1300 early evening (Europe) on Thursday, and a sharp spike back below what we were at that point looking to as resistance followed. It didn’t last, however, the definition of a spike, we suppose, and the bitcoin price broke back above the 1300 level relatively quickly.
We’re now trading in and around the 1320 mark, and we’re looking for price to hold above 1300 for the next few days as indicative of said level serving as solid support long term.
The break also gives us some nice fresh levels to go at with our intraday strategy, so with that noted, here’s a look at the levels in focus, and where we intend to get in and out of the markets according to the rules of our intraday strategy.
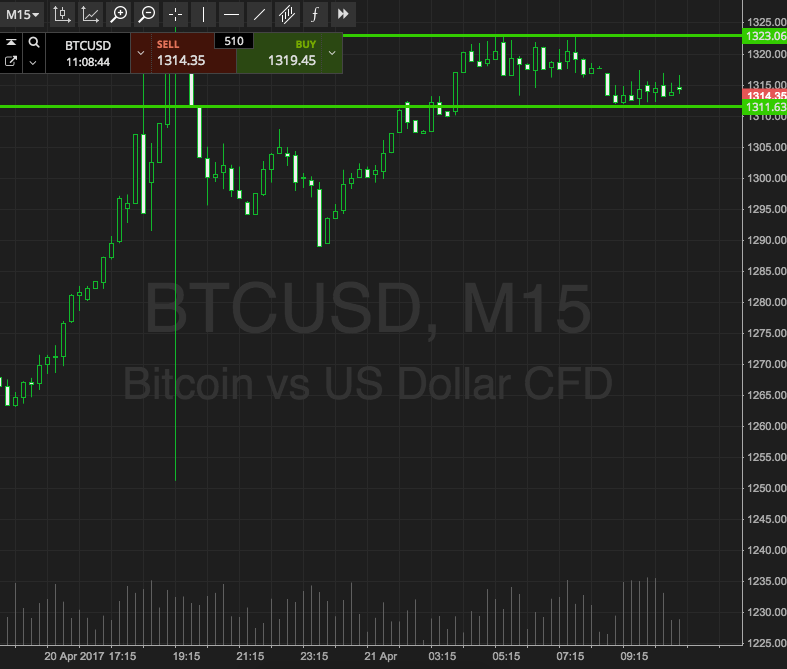
As ever, take a quick look at the chart below to get an idea of what’s on before we get to the detail. It’s a fifteen-minute candlestick chart and it’s got our key range overlaid in green. We’ve gone back to the fifteen-minute time frame to try and take advantage of the slightly longer term breaks, given the recent threshold reach.

So, as the chart shows, the range in focus for today is defined by support to the downside at 1311 and resistance to the upside at 1323. If we see a close above resistance, we’ll be in long towards an upside target of 1235. Conversely, a close below support will put us in towards 1300.
Charts courtesy of SimpleFX


