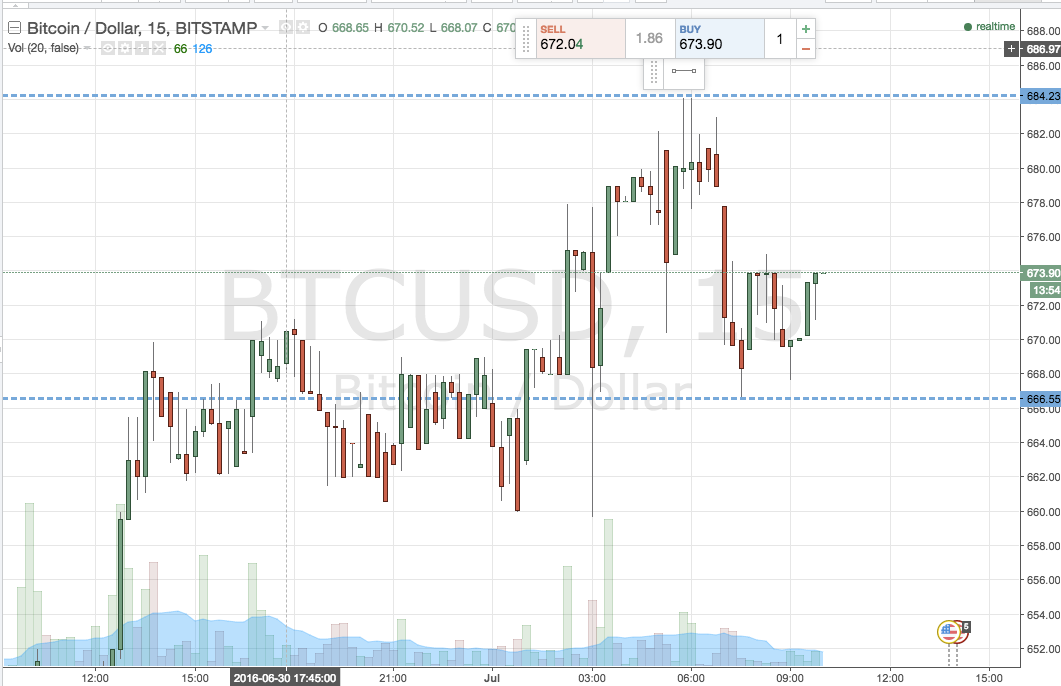
It is Friday morning, and the end of the week from our bitcoin price trading perspective. With this comes the opportunity to take a penultimate look at the markets, in an attempt to figure out what levels might be important today. In yesterday evening’s analysis, we set up a pretty tight range, and action overnight did not disappoint. We managed to get in a long entry on a break above resistance late in the evening, and the trade quickly ran to take out our target for a small gain. With any luck, we can get a rerun today. So, with this said, and as we head into today’s session, here is a look at the levels we are focusing on. First of all, take a quick look at the chart below to get an idea of where things sit. It is a 15 minute the candlestick chart with around 24 hours worth of action displayed.

As the chart shows, our range in focus for today is defined by 666 to the downside for support and 684 to the upside for resistance. It is wide enough for a intrarange strategy, so long on a bounce from support with an immediate upside target of resistance, and short off resistance on a correction to the downside, with a target of support no the short side and with a stop loss just the other side of the entry to define risk.
On the breakout side of things, if price breaks below support it signals a short entry towards 656. It’s a pretty tight target, so we need an equally tight stop loss -somewhere in the region of 670 keeps our risk tight. If price breaks above resistance, we will enter long towards an upside target of 700. A stop on this one around 680 looks good, and will ensure we are taken out of the trade in the event of a bias reversal.
Charts courtesy of Trading View


