We are quickly closing in the end of the week and the bitcoin price has given us plenty to talk about so far. We saw price run into the early start of the week throughout the Monday and Tuesday sessions and – subsequent to this activity – we saw a small amount of corrective activity followed by a return to the overarching upside momentum. Exactly how long we will continue to get this action remains unclear but, in all honesty, it’s not really that important. So long as price is moving, and so long as we have some key levels in place with which we can take advantage of any such movement, we can draw a profit from the market.
The key to ensuring we stay on top of our activity is rooted in making sure we don’t get overexcited and forget to implement a sound risk management strategy. We haven’t had any major problems to date, but nevertheless, we have to maintain discipline across our operations to ensure that we don’t slip up, especially given that we are heading into the end of the week in such a strong position.
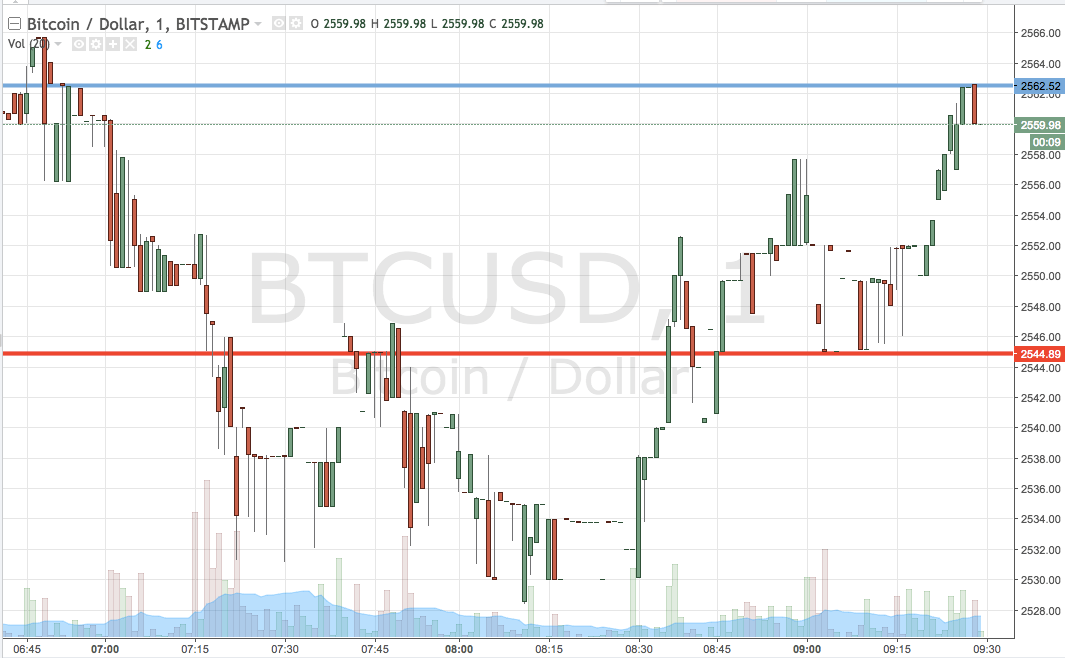
So, with this noted let’s get to the detail. As ever, take a look at the chart below before we get started so as to get an idea of where things stand right now. It is a one-minute candlestick chart and it has our range overlaid in blue and red.

As the chart shows, the range we are looking at for the session today is defined by support to the downside at 2554 and resistance to the upside at 2562. This is a pretty wide range, meaning we have plenty of room for aggressive targets. Breakout only for now, so, if we see a close above support, we will enter long towards 2595. Conversely, a close below support will have us short towards 2520.
Charts courtesy of Trading View


