It’s Monday morning and we are off on a fresh session of trading in the bitcoin price. Last week, we were focused on the various resistance levels that price had broken throughout the daytime sessions and we highlighted 4000 flat as a level to keep an eye on over the weekend. Specifically, we suggested that if we see a break of this level, we could see some follow-through bullish strength as participants got in on the back of a key level break. As it turned out, we did get this break and we did get the follow-through run. Whether it will last throughout the remainder of August remains to be seen – we are still due some degree of correction, something we have noted a couple of occasions so far this month. As yet, however, the correction seems to be elusive, and this means control is still well and truly with the bulls.
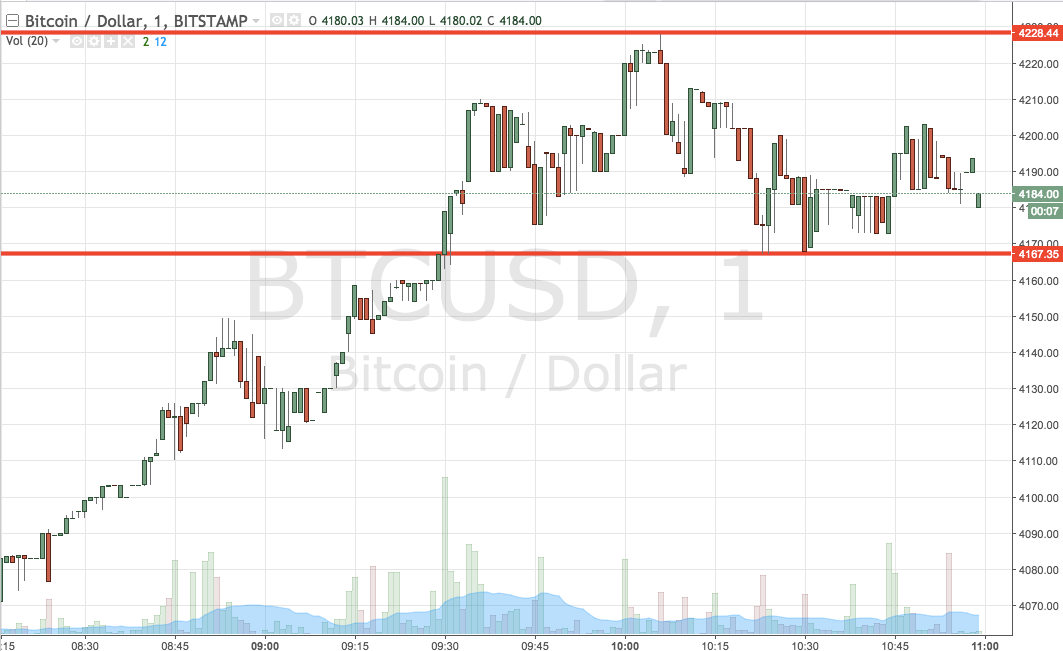
As we kick off this week, then, let’s get some levels in place with which we can seek to profit from the market. As ever, take a quick look at the chart below before we get started to get an idea of the levels that we have in place for the session. It is a one-minute candlestick chart and it has our key range overlaid in red.

As the chart shows, the range we are looking at for the session today is defined by support the downside at 4167 and resistance to the upside at 4228. This is a pretty wide range, so we can be pretty flexible with our stop losses. Specifically, if we see a close above resistance, we will look to enter long towards an immediate upside target of 4250 with a stop loss at 4215. Conversely, a close below support will have is in short towards 4130 with a stop loss at 4170 defining risk.
Chart courtesy of Trading View


