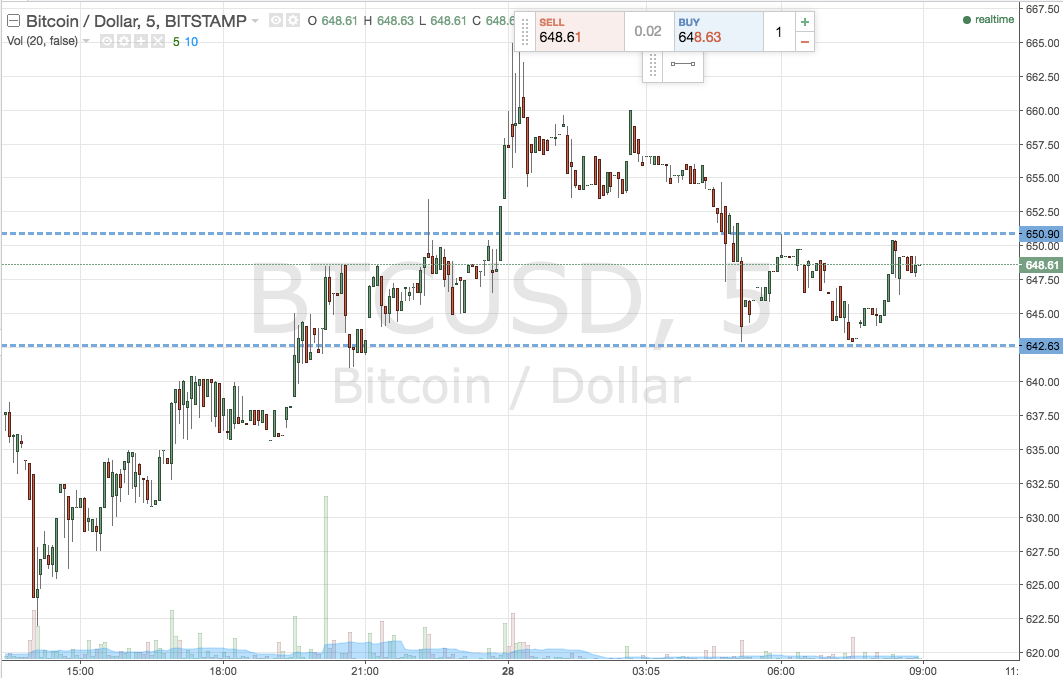
Across pretty much the entirety of yesterday’s session in the bitcoin price, we saw an upside run. Marred by the odd correction, this run brought price to trade at what amounted to fresh weekly highs just ahead of 665, shortly before the day drew to a close. This is, of course, still quite a long way off the highs that came about last week, so this means two things. First, that there is still plenty of room to the upside if volume can hold price up for another sustained run. Second, that if we get this run, there will be some relatively easily identifiable near term targets that we can use as key levels, based on action from just last week. The nearer term these targets, the stronger they normally turn out to be.
So, as we head into a fresh day’s session out of Europe, and with what we’ve just said in mind, let’s take a look at the key levels in focus for today that define our intraday range, and how we intend to go at these levels from a breakout strategy perspective.

One thing to note is that (as the chart above illustrates) bitcoin price has declined from the highs and has since ranged sideways. This isn’t a bad thing, as it gives us a nice narrow range to play with, and it hopefully represents a little bit of coiling and – in turn – pressure building.
So, we’re looking at in term support to the downside at 642 flat, and in term resistance to the upside at 650 flat.
If price logs a close above in term resistance, we will look to enter long towards an initial upside target of 665. Conversely, a close below support will signal a short entry towards 630. A stop on both just the other side of the entry defines risk nicely.
Charts courtesy of Trading View


