
Reason to trust
How Our News is Made
Strict editorial policy that focuses on accuracy, relevance, and impartiality
Ad discliamer
Morbi pretium leo et nisl aliquam mollis. Quisque arcu lorem, ultricies quis pellentesque nec, ullamcorper eu odio.
Key Points
- Bitcoin price failed to move above the $6,400-6,410 resistance area against the US Dollar.
- There is a key bearish trend line in place with resistance at $6,405 on the hourly chart of the BTC/USD pair (data feed from Kraken).
- The price is currently trading below the $6,410 resistance and the 100 hourly simple moving average.
Bitcoin price is trading lower within range below $6,410 against the US Dollar. BTC/USD could revisit the $6,370 or $6,350 support levels if sellers gain control.
Bitcoin Price Analysis
Recently, there was a minor upside correction above the $6,400 resistance in bitcoin price against the US Dollar. However, the BTC/USD pair failed to settle above the $6,400-6,410 resistance area. Later, there was a fresh decline below the $6,400 level and the 100 hourly simple moving average. The price broke the 50% Fib retracement level of the recent wave from the $6,356 low to $6,418 high.
However, the price found support near the $6,380 level. Moreover, the 61.8% Fib retracement level of the recent wave from the $6,356 low to $6,418 high also acted as a support. Besides, there is a bullish trend line formed with support at $6,380 on the hourly chart of the BTC/USD pair. If there is a downside break below the trend line, the price could decline back towards the $6,350-55 zone. On the upside, an initial resistance is near $6,400. There is also a key bearish trend line in place with resistance at $6,405 on the same chart.
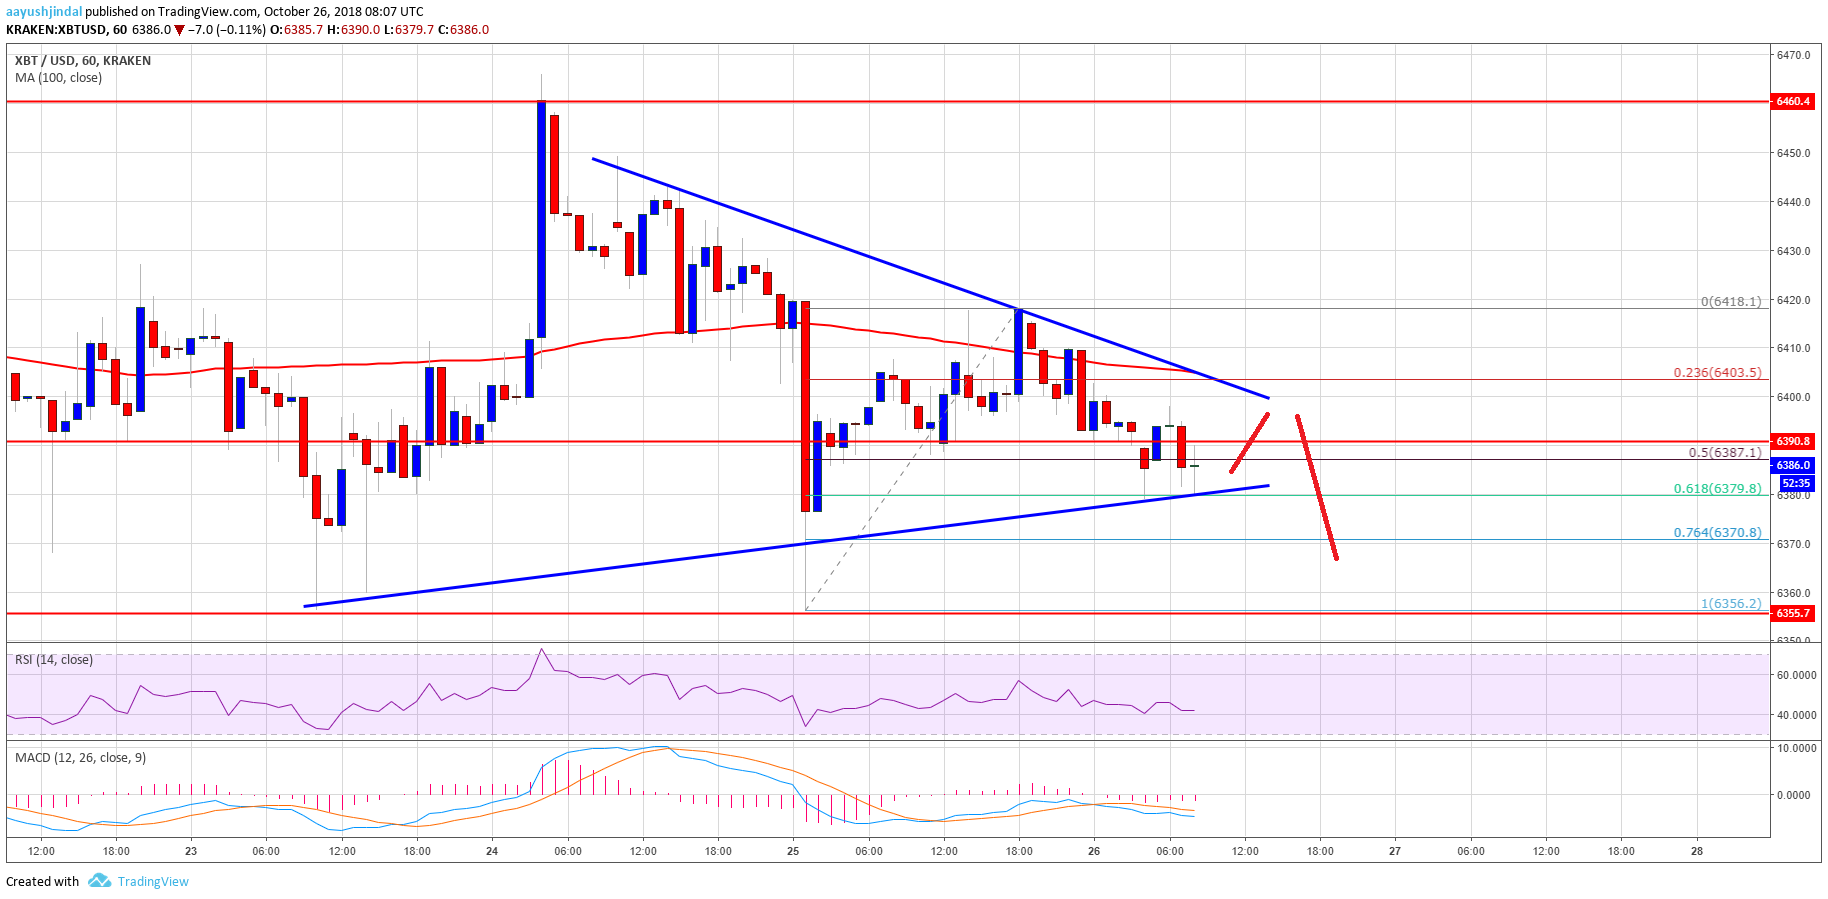
Looking at the chart, bitcoin price is struggling to gain momentum above $6,400 and $6,410. As long as there is no close above $6,410 and the 100 hourly SMA, the price could decline back towards the $6,355 level. On the upside, a break above $6,410 could push the price towards $6,460.
Looking at the technical indicators:
Hourly MACD – The MACD for BTC/USD is slowly moving in the bearish zone.
Hourly RSI (Relative Strength Index) – The RSI is currently just above the 40 level.
Major Support Level – $6,355
Major Resistance Level – $6,410


