We’ve come to the end of the week for our daily bitcoin price analysis, and it has been quite an interesting one, to say the least. After the initial sharp run we saw last Sunday (which came on the back of a previous run seen throughout the holiday period) and the follow-through heading into the middle of the week, price seemed to have had enough, and took a nose dive. The bitcoin price broke support at 1200, 1100, then 1000 – levels we had smashed through just days earlier, and fell to find what amounts to (albeit weak) support around current levels.
What happens from here on out is anyone’s guess. If this author was to have a go at a near term forecast, I reckon current levels will serve to hold as support, and then we’ll see a run back up to test the 1000 mark. How price will react once it’s reached, however, I couldn’t say.
Luckily, I don’t have to. We’re short term horizon here, and we trade a simple strategy. IN on a break, out on a predefined target.
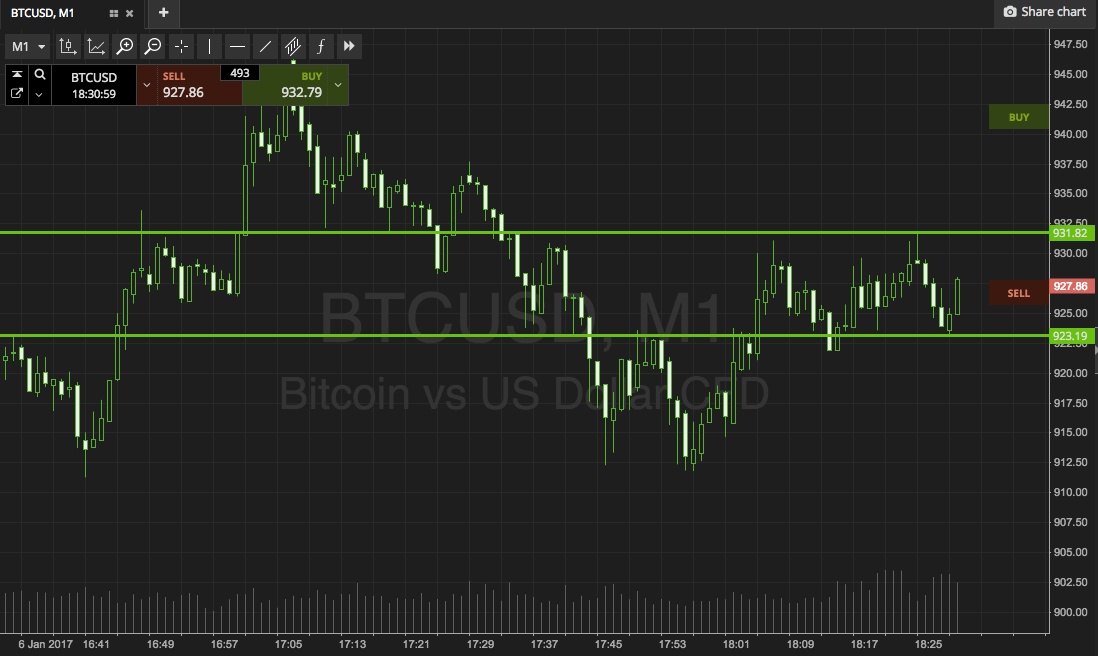
So, with this in mind, and as we head into today’s session, what are the levels we are watching in the current bitcoin price environment, and where are we looking to get in and out the markets according to our strategy? As ever, take a quick look at the chart to get an idea of what we are watching, and the range that defines today’s session.

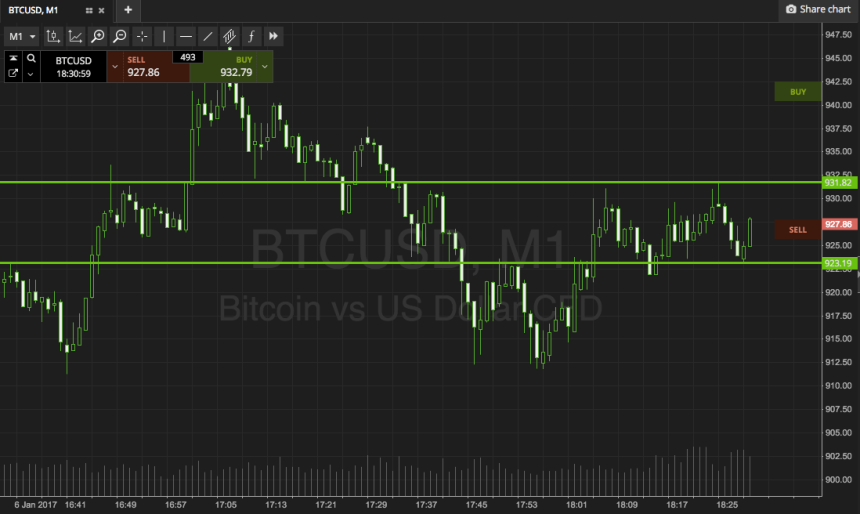
As the chart shows, today’s range is defined by support to the downside at 923, and resistance to the upside at 931. For those looking for a little more aggressive an entry, however, intrarange is acceptable as long as tight stops are used.
From a breakout perspective, a close above resistance will signal a bullish trade towards an initial upside target of 940. A stop loss on the trade somewhere around 928 defined risk.
Looking the other way, a short trade will signal entry on a break and a close below support, and we will enter towards a primary downside target of 913. A stop on this one at 926 again looks good from a risk management perspective.
Charts courtesy of SimpleFX


